


Maghrabi Abdullrahman
National Centre for Applied Physics, King Abdulaziz City for Science and Technology, P.O. Box 6086 Riyadh 11442, Saudi Arabia.
*Corresponding Author: Maghrabi Abdullrahman, National Centre for Applied Physics, King Abdulaziz City for Science and Technology, P.O.
Abstract
Background
The transmission of infectious diseases is influenced by environmental and meteorological factors.
Methods
In this study, the influence of several such factors in the transmission of COVID-19 cases in six cities in Saudi Arabia was investigated using the Spearman and Kendall rank tests. For this purpose, the reported COVID-19 data from six cities in Saudi Arabia for the period between 26 March 2020 to 10 August 2021 was used along with several meteorological factors, such as the average, maximum, and minimum values of air temperatures, air pressure, wind speed, relative humidity, dew point temperatures, and the average values of absolute humidity.
Results
The results for all the cities revealed that air temperature (average, minimum, and maximum) are positively associated with the daily number of COVID-19 cases reported in these cities. However, relative humidity and atmospheric pressure (averages, minimum, and maximum) are anti-correlated with the number of daily COVID-19 cases. For the rest of the variables, the correlation, strength, and significance with regard to the COVID-19 cases were different from one city to another.
Conclusions
The findings presented in this paper are in total agreement with some of the previously established studies and are in contradiction either partially or entirely with others conducted at several locations around the world. The obtained results showed that the meteorological variables, significantly, affect the spread of COVID-19. This will help the epidemiologists to understand the behavior of the virus against meteorological variables and can be considered as a useful supplement to help national and international organizations and healthcare policymakers in the process of strategizing to combat COVID-19.
Keywords: COVID-19; Biology; public health, infection disease; meteorological factors
Introduction
Since the identification of the novel coronavirus infection in Wuhan, China, in December 2019, the disease has spread worldwide, developing into a pandemic and becoming one of the most significant global public health concerns (WHO, 2020). Shortly afterward, several research activities across a wide range of fields were conducted worldwide to understand the causes influencing the virus, and to help people and decision-makers devise protection measures and reduce its ongoing threat. These include the association between COVID-19 and social, economic, environmental, and meteorological factors. Studies on the associations between COVID-19 and weather factors have been conducted in different regions around the world including China, the US, and Europe. e.g., [3,4,7,8,11,13,15,18]
It has been established that meteorological factors have significant, direct or indirect, impacts on the transmission of viruses and gene mutation. The COVID-19 outbreak has spread around the world across different geographical regions and climatic conditions. Consequently, the behavior and the dynamic of the virus transmission will be different from one region to other; hence, the effect of meteorological factors on the spread of COVID-19 must be examined for each region individually. This will provide a better understanding of the influence of the weather conditions on the virus and help authorities decide on the necessary control strategies [10].
Saudi Arabia is among the countries affected by the COVID-19 virus, which has infected more than half a million people and led to 10000 deaths. Therefore, it will be useful to investigate the effect of the meteorological conditions in Saudi Arabia on the spread of COVID-19. This region of the world is characterized by a wide range of climatic conditions. For this purpose, and due to the data availability limitations, this study will investigate the variations in the weather conditions and their effect on the COVID-19 cases reported in six selected cities. These cities cover a wide range of atmospheric conditions, from hot-dry, moderately humid, to cold. Therefore, the results of this study will help researchers understand the transmission of the virus, may contribute to an increase in the prevention and control measures for the outbreak’s adverse effects on public health.
Material and method
In this study, the relationship between the numbers of patients infected with COVID-19 and the weather parameters from six cities was investigated and statistically analyzed.
Table (1) presents the geographical coordinates for the selected cities, the total number of COVID-19 cases, and the percentage of the infected cases compared to the country’s population. The data of daily COVID-19 cases were taken from the official website of the Saudi Arabian Ministry of Health (MOH). The data used in this study belong to the period from 26 March 2020 to 10 August 2021.
Table 1: indicates the geographical coordinates for the selected cities, the total number of COVID-19 cases, and the percentage of the infected cases compared to the country’s population
|
|
Total cases |
% Compared to the |
Lat. |
Long. |
|
Riyadh |
102,494 |
19.10 % |
24.71° N |
46.67° E |
|
Jeddah |
52,490 |
9.80 % |
21.48° N |
39.19° E |
|
Makah |
45,097 |
8.40 % |
21.38° N |
39.85° E |
|
Taif |
16,469 |
3.10 % |
21.28° N |
40.42° E |
|
Dammam |
25,111 |
4.70 % |
26.42° N |
50.08° E |
|
Medina |
25,522 |
4.80 % |
24.52° N |
39.56° E |
The meteorological variables considered in the study include the maximum, minimum, and average values of the air temperature, relative humidity, atmospheric pressure, dew point temperature, wind speed (WS), and absolute humidity (AH). These data have been obtained from the Saudi National Bureau of Meteorology (Table 2).
For the selected cities, the average temperature ranges from 9° C to 41° C, the average relative humidity ranges between 5 % and 88 %, the average WS ranges between 0.63 m/s and 10 m/s, and the average air pressure ranges between 846 hPa and 1015 hPa.
It is clearly seen that the selected cities cover a wide range of weather conditions from very hot, moderate, humid, dry, and desert climates.
Table 2: indicates the statistical parameters of the mean values of the considered variables for each city during the study period.
The nonparametric Spearman’s rank and Kendall rank tests were used in the study to examine the associative strength between two variables (monotonic relationship). The Spearman rank correlation tests were calculated using equation (1):
|
|
τ |
Tdew |
RH |
WS |
ρ |
AH |
|
|
Riyadh |
|
||||
|
Mean |
29.20 |
4.88 |
25.96 |
2.83 |
941.09 |
6.78 |
|
Std. Dev. |
8.08 |
3.89 |
14.97 |
1.22 |
5.81 |
1.90 |
|
Minimum |
9.67 |
-7.06 |
9.40 |
0.63 |
931.26 |
3.00 |
|
Maximum |
41.06 |
20.11 |
88.90 |
7.96 |
954.96 |
17.02 |
|
|
Jeddah |
|||||
|
Mean |
30.58 |
18.58 |
51.70 |
3.71 |
1006.73 |
16.27 |
|
Std. Dev. |
3.50 |
4.49 |
10.08 |
1.22 |
4.22 |
3.71 |
|
Minimum |
21.28 |
2.22 |
19.60 |
1.48 |
998.98 |
5.36 |
|
Maximum |
36.94 |
26.61 |
72.00 |
8.49 |
1015.92 |
24.64 |
|
|
Makkah |
|
||||
|
Mean |
25.14 |
4.28 |
31.86 |
4.61 |
853.19 |
6.93 |
|
Std. Dev. |
4.91 |
5.38 |
15.81 |
1.58 |
2.41 |
2.45 |
|
Minimum |
11.89 |
-11.94 |
7.50 |
1.92 |
846.60 |
1.94 |
|
Maximum |
33.11 |
17.00 |
79.50 |
10.33 |
860.14 |
14.46 |
|
|
Dammam |
|||||
|
Mean |
29.93 |
10.46 |
37.82 |
4.09 |
1005.79 |
10.94 |
|
Std. Dev. |
7.63 |
6.06 |
16.91 |
1.60 |
8.08 |
4.55 |
|
Minimum |
11.83 |
-5.22 |
9.40 |
1.21 |
988.83 |
3.47 |
|
Maximum |
41.83 |
26.00 |
87.30 |
10.77 |
1022.69 |
26.10 |
|
|
Medina |
|||||
|
Mean |
31.32 |
0.74 |
17.61 |
3.47 |
936.75 |
5.26 |
|
Std. Dev. |
6.62 |
5.74 |
10.86 |
1.05 |
4.18 |
2.37 |
|
Minimum |
15.17 |
-14.56 |
5.40 |
0.72 |
927.87 |
1.66 |
|
Maximum |
41.39 |
18.33 |
58.10 |
7.64 |
948.19 |
15.54 |
|
|
Taif |
|||||
|
Mean |
25.15 |
4.28 |
31.88 |
4.61 |
853.19 |
6.93 |
|
Std. Dev. |
4.92 |
5.39 |
15.82 |
1.58 |
2.41 |
2.45 |
|
Minimum |
11.89 |
-11.94 |
7.50 |
1.92 |
846.60 |
1.94 |
|
Maximum |
33.11 |
17.00 |
79.50 |
10.33 |
860.14 |
14.46 |
Where ρ is the Spearman rank correlation coefficient; di is the difference between the ranks of corresponding values xi and yi, and n is the number of x and y pairs.
Kendall rank correlation can be estimated as follows:
Where τ is the Kendall rank correlation coefficient; nc and nd represent the number of concordant and discordant pairs, respectively; and n represents the number of pairs.
Results and Discussions
Figure 1 shows daily confirmed cases in the selected cities during the study period. Since the first confirmed case on the 2nd of March 2020, the number of confirmed COVID-19 cases in Saudi Arabia reached more than half a million by the time of this study. The total number of COVID-19 cases for the selected cities represents about 50 % of Saudi Arabia’s total number of cases (Table 1). Riyadh has the highest number of confirmed COVID-19 cases (102494 cases; 19.10 % of the country’s total cases), followed by Jeddah (52490 cases; 9.80 %) and Makah (45097 cases; 8.40 %). The number of COVID-19 cases in both Dammam (25111 cases; 4.70 %) and Medina (25522 cases; 4.80 %) is almost the same. Taif (16469 cases; 3.10 %) reported the lowest number of COVID-19 cases. It is important to mention that Jeddah, Makah, and Taif are all major cities in the Makah province, with a total of 114056 COVID-19 cases, which is about 21 % of the total number of cases in Saudi Arabia.
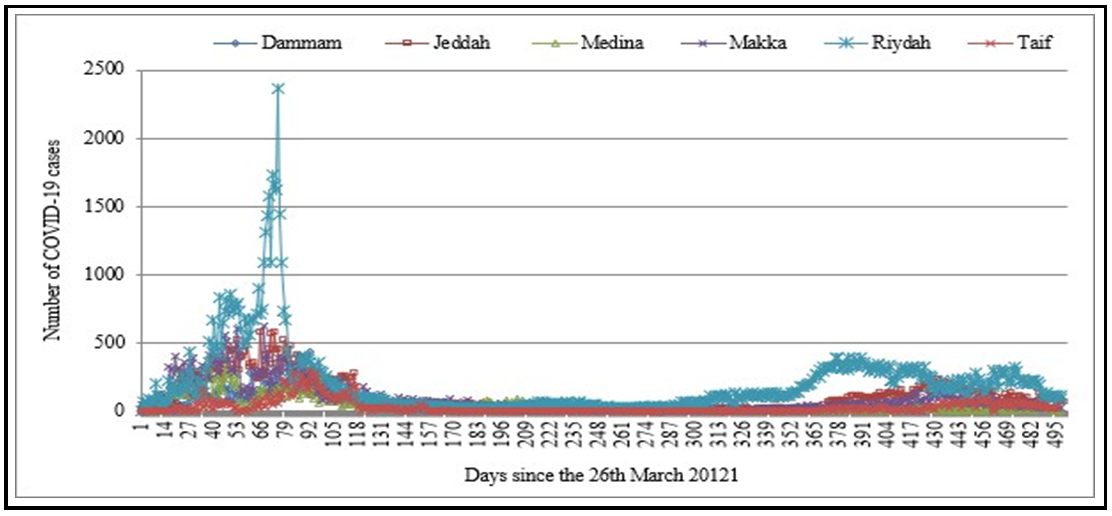
Figure (1) Shows the number of confirmed cases for the six cities in Saudi Arabia since the first day (26 March 2020).
The results of the nonparametric tests between the number of confirmed COVID-19 cases and the selected meteorological variable for each city are presented in Table (3).
Table 3: Summary of nonlinear correlation results between COVID-19 and meteorological parameters (26 April 2020 to 1 August 2021) for the six considered cities.
|
Spearman |
|
Tmax |
Tav |
Tmin |
Tdewmax |
Tdewav |
Tdemin |
RHmax |
RHav |
RHmin |
WSmax |
WSav |
WSmin |
Pmax |
Pav |
Pmin |
AH |
|
Damam |
N=496 |
.653** |
.657** |
.635** |
.181** |
.004 |
-.099* |
-.459** |
-.561** |
-.524** |
.274** |
.119** |
-.074 |
-.683** |
-.670** |
-.668** |
.018 |
|
|
|
.000 |
.000 |
.000 |
.000 |
.932 |
.027 |
.000 |
.000 |
.000 |
.000 |
.008 |
.098 |
.000 |
.000 |
.000 |
.696 |
|
Taif |
N=496 |
.717** |
.733** |
.744** |
.040 |
-.104* |
-.121** |
-.442** |
-.457** |
-.411** |
.430** |
.518** |
.428** |
-.608** |
-.610** |
-.564** |
-.128** |
|
|
|
.000 |
.000 |
.000 |
.379 |
.020 |
.007 |
.000 |
.000 |
.000 |
.000 |
.000 |
.000 |
.000 |
.000 |
.000 |
.004 |
|
Jeddah |
N=499 |
.265** |
.253** |
.238** |
.179** |
.173** |
.136** |
.024 |
-.091** |
-.019 |
.114** |
.118** |
.041 |
-.398** |
-.384** |
-.380** |
.162** |
|
|
|
.000 |
.000 |
.000 |
.000 |
.000 |
.000 |
.433 |
.002 |
.538 |
.000 |
.000 |
.228 |
.000 |
.000 |
.000 |
.000 |
|
Makkah |
N=497 |
.703** |
.689** |
.671** |
.065 |
-.105* |
-.163** |
-.419** |
-.453** |
-.484** |
.367** |
.413** |
.335** |
-.483** |
-.480** |
-.522** |
-.109* |
|
|
|
.000 |
.000 |
.000 |
.146 |
.019 |
.000 |
.000 |
.000 |
.000 |
.000 |
.000 |
.000 |
.000 |
.000 |
.000 |
.015 |
|
Madina |
N=498 |
.422** |
.424** |
.417** |
.010 |
-.015 |
-.019 |
-.297** |
-.316** |
-.340** |
.072 |
-.045 |
-.110* |
-.428** |
-.406** |
-.415** |
-.032 |
|
|
|
.000 |
.000 |
.000 |
.829 |
.733 |
.679 |
.000 |
.000 |
.000 |
.107 |
.320 |
.014 |
.000 |
.000 |
.000 |
.474 |
|
Riydah |
N=499 |
.470** |
.480** |
.473** |
.139** |
-.003 |
-.085 |
-.430** |
-.477** |
-.456** |
.269** |
.205** |
.081 |
-.417** |
-.425** |
-.439** |
-.036 |
|
|
|
.000 |
.000 |
.000 |
.002 |
.947 |
.057 |
.000 |
.000 |
.000 |
.000 |
.000 |
.070 |
.000 |
.000 |
.000 |
.422 |
|
Kendall |
|
Tmax |
Tav |
Tmin |
Tdewmax |
Tdewav |
Tdemin |
RHmax |
RHav |
RHmin |
WSmax |
WSav |
WSmin |
Pmax |
Pav |
Pmin |
AH |
|
Damam |
N=496 |
.462** |
.450** |
.440** |
.124** |
.001 |
-.067* |
-.320** |
-.393 |
-.365** |
.191** |
.080** |
-.056 |
-.499** |
-.491** |
-.490** |
.010 |
|
|
|
.000 |
.000 |
.000 |
.000 |
.969 |
.030 |
.000 |
.000 |
.000 |
.000 |
.008 |
.102 |
.000 |
.000 |
.000 |
.752 |
|
Taif |
N=496 |
.529** |
.530** |
.554** |
.030 |
-.072* |
-.085** |
-.320** |
-.329** |
-.289** |
.310** |
.365** |
.323** |
-.486** |
-.496** |
-.456** |
-.089** |
|
|
|
.000 |
.000 |
.000 |
.332 |
.018 |
.007 |
.000 |
.000 |
.000 |
.000 |
.000 |
.000 |
.000 |
.000 |
.000 |
.004 |
|
Jeddah |
N=499 |
.265** |
.253** |
.238** |
.179** |
.173** |
.136** |
.024 |
-.091** |
-.019 |
.114** |
.118** |
.041 |
-.398** |
-.384** |
-.380** |
.162** |
|
|
|
.000 |
.000 |
.000 |
.000 |
.000 |
.000 |
.433 |
.002 |
.538 |
.000 |
.000 |
.228 |
.000 |
.000 |
.000 |
.000 |
|
Makkah |
N=497 |
.526** |
.501** |
.489** |
.046 |
-.076* |
-.113** |
-.295** |
-.319** |
-.343** |
.261** |
.282** |
.243** |
-.370** |
-.373** |
-.411** |
-.080** |
|
|
|
.000 |
.000 |
.000 |
.135 |
.012 |
.000 |
.000 |
.000 |
.000 |
.000 |
.000 |
.000 |
.000 |
.000 |
.000 |
.008 |
|
Madina |
N=498 |
.277** |
.272** |
.269** |
.006 |
-.011 |
-.012 |
-.196** |
-.205** |
-.231** |
.049 |
-.033 |
-.088* |
-.313** |
-.298** |
-.305** |
-.022 |
|
|
|
.000 |
.000 |
.000 |
.835 |
.728 |
.708 |
.000 |
.000 |
.000 |
.115 |
.279 |
.012 |
.000 |
.000 |
.000 |
.469 |
|
Riydah |
N=499 |
.317** |
.313** |
.313** |
.091** |
-.001 |
-.056 |
-.284** |
-.312** |
-.312** |
.182** |
.134** |
.063 |
-.289** |
-.298** |
-.308** |
-.021 |
|
|
|
.000 |
.000 |
.000 |
.003 |
.983 |
.074 |
.000 |
.000 |
.000 |
.000 |
.000 |
.068 |
.000 |
.000 |
.000 |
.494 |
**. Correlation is significant at the 0.01 level (2-tailed).
It is obvious that the number of confirmed COVID-19 cases in all the cities significantly correlated (99 % confidence level) with the maximum, average, and minimum temperatures (T max, T av, T min), and anti-correlated with the average values of relative humidity (RH), and the maximum, average, and minimum value of the atmospheric pressure (P max, P av, P min). The correlation, strength, and significance between the COVID-19 cases and the other variables varied from one city to another. For instance, all the cities, with exception of Jeddah, have significant anti-correlations with maximum and minimum relative humidity.
The number of COVID-19 cases showed a positive correlation with AH in Taif, Jeddah, Makah, and no significant relationship with the COVID-19 cases in the remaining cities. Moreover, the average and maximum WS showed significant correlations with the number of COVID-19 cases in all the cities except Medina and Riyadh. The average values of the dew point temperatures correlated with the number of COVID-19 cases in Taif, Jeddah, Makah, and no significant correlations were found for the COVID-19 cases reported in the rest of the cities. The number of COVID-19 cases in Medina and Riyadh showed no significant correlations with the minimum dew point temperature whereas the remaining cities showed significant correlations. The maximum values of WS correlated significantly with the COVID-19 cases reported in Taif, Makah, and Medina, and have no significant relationship with the COVID-19 cases found in the remaining cities.
The findings presented above are in total agreement with some of the previously established studies and are contradicted either partially or totally with others conducted at several locations around the world. For instance, our finding of the positive effect of the mean temperature and WS on the number of COVID-19 cases is supported by [2,8,12,13,14] reported that only the mean air temperature was significantly correlated with the transmission of COVID-19. According to [5], temperature and AH have been reported as crucial weather indices associated with the spread of COVID-19. [1] established that mean temperature and average relative humidity are significant in the transmission of COVID-19 in Brazil. [15] showed that warm weather plays an important role in suppressing the virus.
[6] found that temperature and WS have a negative relationship with the number of infections. [18] conducted a study in 122 cities across China and established that humidity, WS, and temperature are inversely associated with the infection rate of COVID-19. [9,17] stated that the temperature and RH were both negatively associated with daily new cases and mortality.
Conclusions
In this study, the effects of several meteorological variables on the number of COVID-19 cases in six cities in Saudi Arabia for the period between 26 March 2020 to 10 August 2021 were investigated.
The considered variables were the average, maximum, and minimum values of air temperatures, air pressure, wind speed, relative humidity, dew point temperatures, and the average values of absolute humidity. The total number of COVID-19 cases for the selected cities represents about 50 % of Saudi Arabia’s total number of cases.
The results for all the cities revealed that air temperature (average, minimum, and maximum) is positively associated with the daily number of COVID-19 cases reported in these cities. However, relative humidity and atmospheric pressure (averages, minimum, and maximum) are anti-correlated with the number of daily COVID-19 cases. For the rest of the variables, the correlation, strength, and significance with regard to the COVID-19 cases were different from one city to another.
While the infected cases might have been impacted by several additional factors—such as social behaviors, demography, and epidemiology factors—making the number of confirmed cases due to meteorological factors possibly inaccurate, our results and the findings from different studies, the meteorological factors, though they exert different degrees of influence, do have pronounced effects on COVID-19 transmission.
This study is significant as it covers a longer period than most of the previous research, includes a wide range of meteorological conditions. The findings presented in this paper can be useful for the development of influenza surveillance and early warning systems. Moreover, these results can be of great importance and contribute greatly to epidemiology investigations not only with respect to the current COVID-19 pandemic but also for a future understanding of the relationship between the factors that affect the epidemiological characteristics caused by viruses in order to control their spread.
Funding source: No funding was provided for this work.
Ethical approval: Not applicable
Conflict of interest: All authors declare no conflict of interest.
Acknowledgments: The authors would like to thank King Abdulaziz City for Science and Technology (KACST) for supporting this work.
References
- Auler AC, Cássaro FAM, da Silva VO, Pires LF (2020). Evidence that high temperatures and intermediate relative humidity might favor the spread of COVID-19 in tropical climate: a case study for the most affected Brazilian cities. Science of the Total Environment. 729: 139090.
- Bashir MF, Ma B, Bilal, Komal B, Bashir MA, et al (2020). Correlation between climate indicators and COVID-19 pandemic in New York, USA. Science of the Total Environment. 728: 138835.
- Ceylan Z (2021) Insights into the relationship between weather parameters and COVID-19 outbreak in Lombardy, Italy. International Journal of Healthcare Management. 14(1): 255-263.
- Chaudhry R, Dranitsaris G, Mubashir T, Bartoszko J, Riazi S (2020) A country level analysis measuring the impact of government actions, country preparedness and socioeconomic factors on COVID-19 mortality and related health outcomes. EClinicalMedicine. 25: 100464.
- Gupta S, Raghuwanshi GS, Chanda A (2020) Effect of weather on COVID-19 spread in the US: a prediction model for India in 2020. Science of the Total Environment. 728: 138860.
- Islam N, Shabnam S, Erzurumluoglu AM (2020) Temperature, humidity, and wind speed ar e associated with lower Covid-19 incidence. MedRxiv. 1-4.
- Martins LD, da Silva I, Batista WV, Andrade MF, Freitas ED, et al. (2020) How socio-economic and atmospheric variables impact COVID-19 and influenza outbreaks in tropical and subtropical regions of Brazil. Environmental Research. 191: 110184.
- Park JE, Son WS, Ryu Y, Choi SB, Kwon O, et al. (2020) Effects of temperature, humidity, and diurnal temperature range on influenza incidence in a temperate region. Influenza Other Respir Viruses. 14(1): 11–18.
- Qi L, Gao Y, Yang J, Ding X, Xiong Y, et al. (2020) The burden of influenza and pneumoniamortality attributable to absolute humidity among elderly people in Chongqing, China, 2012-2018. Science of the Total Environment. 716: 136682.
- Qu G, Li X, Hu L, Jiang G (2020) An imperative need for research on the role of environmental factors in transmission of novel coronavirus (COVID-19). Environmental Science & Technology. 54(7): 3730–3732.
- Rosario D, Mutz YS, Bernardes PC, Conte-Junior CA (2020) Relationship between COVID-19 and weather: Case study in a tropical country. Int J Hyg Environ health. 229: 113587.
- Tan J, Mu L, Huang J, Yu S, Chen B, et al. (2005) An initial investigation of the association between the SARS outbreak and weather: with the view of the environmentaltemperature and its variation. J. Epidemiol Community Health. 59(3): 186-192.
- Tosepu R, Gunawan J, Effendy DS, ImranAhmad LOA, Lestari H, et al. (2020) Correlation between weather and covid-19 pandemic in Jakarta, Indonesia. Science of the Total Environment. 725: 138436
- Vandini S, Corvaglia L, Alessandroni R, Aquilano G, Marsico C, et al. (2013) Respiratory syncytial virus infection in infants and correlation with meteorological factors and air pollutants. Ital J Pediatr. 39(1): 1.
- Wang J, Tang K, Feng K, Lin X, Lv W, et al. (2021) Impact of temperature and relative humidity on the transmission of COVID- 19: a modelling study in China and the United States. BMJ, 11(2): e043863.
- WHO. Coronavirus disease (COVID-2019) situation reports. Geneva: World Health Organization, 2021.
- Wu Y, Jing W, Liu J, Ma Q, Yuan J, et al. (2020) Effects of temperature and humidity on the daily new cases and new deaths of COVID-19 in 166 countries. Science of the Total Environment. 729: 139051.
- Xie J, Zhu Y (2020) Association between ambient temperature and COVID-19 infection in 122 cities from China. Science of Total Environment. 724: 138201.