


Francisco J. Ávila1,*, Ismael Embid2, Maria Concepción Marcellán1 and Laura Remón1
1Departament de Fïsica Aplicada, Universidad de Zaragoza, Zaragoza, Spain
2Zbrain Centre, Zaragoza, Spain
*Corresponding author: Francisco J. Ávila, Department de Fïsica Aplicada, Universidad de Zaragoza, Zaragoza, Spain
Abstract
Coronavirus disease (COVID-19) is an infectious disease caused by the SARS-CoV-2 virus that has caused a global pandemic with hundreds of thousands of deaths worldwide. The severity of the disease and the lack of an effective treatment or vaccine have promoted hundreds of simultaneous scientific research throughout the world searching in parallel a cure and accurate diagnostic methods. This work presents a user- friendly and fast novel method based on superpixel segmentation to analyze chest CT images to detect and study positive COVID-19 cases.
Keywords: COVID-19; Computerized Tomography; Superpixel segmentation; image processing.
1. Introduction
Coronavirus disease (COVID-19) is an infectious pathology caused by SARS-CoV-2 virus [1] detected by the first time in Wuhan (China) in December 2019 [2] and declared a global pandemic on March 11th 2020 by the World Health Organization (WHO). On May 15th were confirmed more than 4.44 M cases and 302,376 deaths (according to the public WHO website public information). Fever, tiredness, dry cough, and shortness of breath are the most frequent common symptoms. However, patients who get COVID-19 disease can manifest the disease in many different ways: asymptomatic carriers, mild symptomatic or evolve into severe pneumonia, and over-active immune response causing rapid progression to acute respiratory distress syndrome with fatal outcome [3]. The severity of the disease complications increases with age, immunosuppression, or previous illness. For example, diabetic patients with confirmed COVID-19 infection have associated a two-fold increase in mortality as compared with non-diabetic [4].
The impressive evolution of the COVID-19 disease [5], the high infectivity ratio, mortality rate, and the absence of a vaccine have activated an unprecedented scientific research outbreak throughout all related scientific disciplines around the world searching for an efficient cure [3-6] such as convalescent plasma transfusions [7] and Hydroxychloroquine [8] potential treatments, for instance. In parallel, the vaccine against COVID-19 is being developed in about 90 institutions worldwide [9].
On the other hand, characterizing the disease [10] appears critical for accurate and early detection of the COVID-19 infection. Chest CT imaging has been proved as a potential complement to Polymerase Chain Reaction (PCR) tests in the diagnosis of positive COVID19 results [11].
A report of 1014 cases in China concluded that Chest CT may be considered as a primary tool for the current COVID-19 detection in epidemic areas [12]. A recent finding has reported structural abnormalities in Chest CT images of COVID-19 patients [13].
In that sense, Deep Learning-based (DL) methods have been employed for screening chest CT images to assist radiologists [14]. Although DL approaches have been proved as efficient tools for the assessment of medical images [15], usually it requires large datasets, long processing times, and complex operations.
In Computer Vision, Super pixel (SP) algorithms are used for image segmentation, classification, and detection. SP segmentation has been successfully employed for the detection of tumors [16] or for the assessment of the Crohns disease [17], for instance.
The aim of this work is to provide a fast, user-friendly, and accurate digital method to help radiologist in the assessment of the Chest CT images using SP quantitative analysis. The proposed methodology has been tested in an open-source Chest CT dataset. Results showed the capabilities of the method for accurate segmentation of the lung areas as well as to distinguish between positive COVID-19 Chest CT images from the negative ones by objective information extraction of the segmented SPs.
2. Methods
2.1 Public Image Dataset
A publicly available COVID-19 dataset CT scan images were used for testing the proposed method (see Section 2.2), more details on the dataset can be found in [18] (The dataset is available in this repository https://github.com/UCSD-AI4H/COVID-CT). This dataset contains CT scans that are positive and negative to COVID-19. From the dataset 50 CT-COVID and 50 COVID negative images were randomly chosen to be processed. Figure 1 shows an example of negative and positive COVID-19 Chest CT images, respectively.
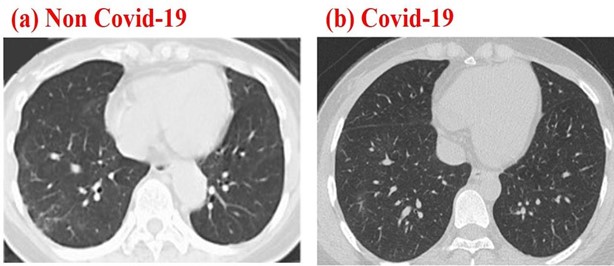
Figure 1: Chest CT images corresponding to a negative (a) and positive Chest CT images
2.2 Superpixel Algorithm
In digital image processing, image segmentation is defined as the process of partitioning an image into a given number of clusters. SP segmentation technique [19] groups the pixels with the similar color or grayscale levels and structural properties. In other words, SP segmentation groups structurally similar pixels of an image to create meaningful segments or clusters that are sensitive to low-level properties (SPs). In this work, a custom script has been written in Matlab® programming language for processing the chest CT images.
The “superpixels” function uses a simple linear iterative clustering algorithm.
Within the algorithm, the inputs of the function correspond to (a) reading CT images; (b) SP_N, number of SP to be detected; (c) I_N, number of iterations of the process, and (d) C, compactness parameter that defines the irregularity rate of SPs. All the inputs are defined by the user and do not vary during the number of fixed iterations while code is compiling. Obviously, the greater the number of SPs and iterations, the better the boundaries to be detected but longer the processing time. Image 2 shows a flowchart of the algorithm, the input parameter chosen by the authors for a given input image, and the image segmentation results. The SPs are overlaid by blue outlines, the SP cluster is numbered in red within each SP.
The algorithm works in sequential processing as follows: First, the input image is read, and the initial parameters are stabilized by the user. Then, the program runs the rest of the procedures automatically. Once the image is segmented into SPs, those clusters that are not lung areas are discarded. The output image is formed “only” by lung clusters.
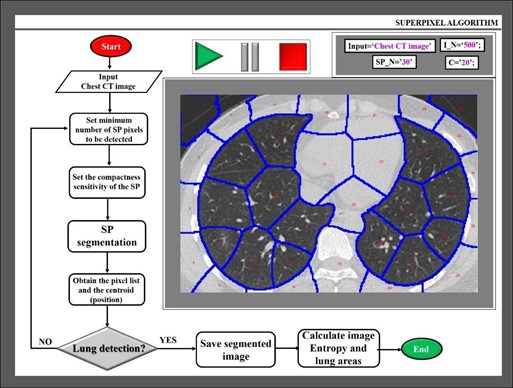
Figure 2: Flowchart of the proposed algorithm and example of a processed CT scan image
Once the segmented final image is completed, the total lung area is calculated as the sum of every individual SP. From a structural point of view, the resolution and fine details that can be seen are crucial for a global evaluation of the CT scan images. In this sense, Shannon Entropy (SE) is an objective image metric assessment that has been widely employed in medical imaging [20] as contains the amount of information of the analyzed area.
One of the advantages of SE lies in the calculation that is independent of the object size. In particular, SE has been employed for quantitative evaluation of CT images, the finding revealed higher SE values for lower image quality [21].
In this work, SE is proposed as an objective parameter for quantifying how much structural information is contained in Chest CT images, this information evaluates the image quality and therefore the inspection capabilities by the analyst. Finally, a statistical analysis is performed in R Commander statistical software (GNU General Public License) comparing positive and negative COVID results.
3. Results
The main goal of this work is to provide a feasible and easy-to-use fast application for CT scan image segmentation containing parametric information that can help radiologists for accurate detection of positive COVID-19 cases while working on the arduous task of analyzing hundreds of CT images. In this sense, Figure 3a shows the image of figure1b after applying SP segmentation. In this case, the SP_N, I_N, and C were 300, 500, and 20, respectively. A visual inspection reveals that the lung contours are perfectly traced. The higher the SP_N, the higher the small details that can be locked in every SP to be structurally analyzed. After removing those SPs out of the lung area, all SPs are integrated into two huge SPs corresponding to each lung as shown in figure 3b. At this point, the algorithm calculates the area of the lungs.
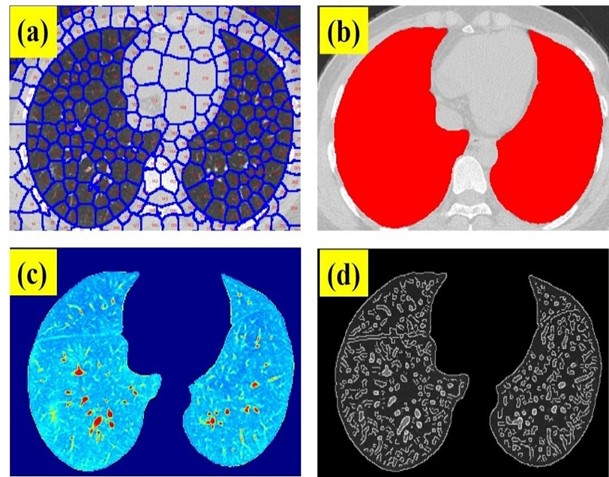
Figure 3: (a) SP clustering of a Chest CT image of a positive COVID-19 patient; (b) overlay of the segmented lung areas on the original image; (c) SP segmented final image and (d) edge detection of the structural details of the segmented image.
Figure 3b shows the final output image formed by the isolated SPs within the lung areas. This is a real intensity image without any structure than the lungs. Using the Mat lab function “edge”, which calculates the gradient of the image using the derivative of a Gaussian filter, fine details of the image can be identified and located by detecting strong and weak edges as shown in figure 3c.
This figure shows the structural details of the lungs of the segmented chest CT scan image of Figure 3a, and finally, the SE is calculated for this image. Once the Chest CT images described in Methods were processed, the lung area and SE were computed for each sample including 50 negative and 50 positive cases. Figure 4 shows the SE and lung area ratios (ratio between positive and negative cases), respectively. As can be observed despite the obvious variability in the cases, the ratio values are clearly far from 1 what implies differences in both SE and lung area parameters when comparing positive and negative COVID-19 CT images.
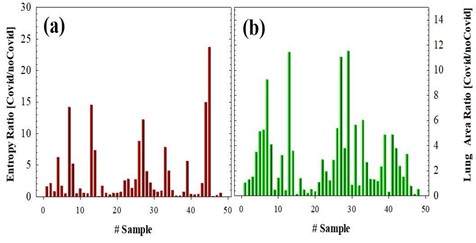
Figure 4: SE (a) and Lung Area (b) ratios for 50 positive and 50 negative COVID-19 cases.
For the sense of completeness, Figure 5 compared the averaged values of SE and lung area values corresponding to negative (black bars) and positive (red bars) COVID-19 cases. Statistical analysis revealed significant differences between negative and positive groups, the P-values are shown in the plots. These results clearly show that positive cases provide “footprints” in Chest CT images that can be detected and quantified using the proposed method to be discriminated from the negative ones.
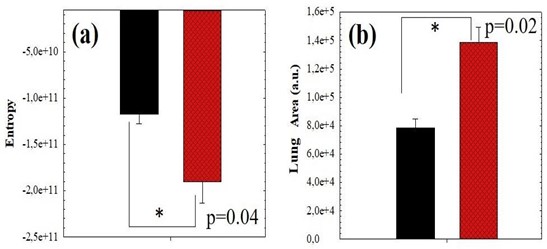
Figure 5: Average value of SE (a) and Pulmonary Area (b) comparing positive (red bars) and negative (black bars) COVID-19 cases corresponding to the data of figure 4.
4. Discussion and Conclusion
Deep Learning can provide invaluable support for pathologists and radiologists working on COVID-19 detection and analysis using Chest CT imaging with advanced recognition analysis [14]. However, obtaining the required data volume may be a bit challenge and in critical scenarios as the COVID-19 pandemic, the timeline plays against the difficulty to extrapolate the interpretation of the results.
In this sense, this work presents an easy-to-use digital segmentation method for the assessment of Chest CT images. The method is based on the SP concept [19] that allows image segmentation or clustering with user-controlled precision. This tool operates automatically and does not require any programming knowledge, the user is only required to open the desired image and set the sensitivity for analysis. As stated in the Results, the lungs can be perfectly isolated from the rest of the chest part. Once the lungs are segmented in clusters, the geometry, perimeter, and the area can be computed and visually inspected with a high contrast image display.
The methods also include a segmentation tool that provides edge detection of the structural features of the lungs, even in those case of the weak signal as shown in figure 3b. From these clustered final images, SE is computed providing objective image quality assessment that allows fast comparison between positive and negative cases.
Working with a randomly selected 50 positives and 50 negatives COVID-19 cases from an open-source dataset [18], the obtained results revealed that SE values are significantly higher for the positive cases, which implies that the image quality and embedded structural information of Chest CT images is statistically lower regarding the negatives ones. This loss of information could be explained due to the inflammatory process caused by the SARS-CoV-2 virus. This fact has been observed in the calculation of the lung areas and according to the statistical analysis, the spatial distribution of the positive cases is significantly higher, which implies an increase in the total area that could be consistent with the inflammatory process.
To conclude, in this work we present a user-friendly and fast operating image segmentation tool to discriminate between positive and negative COVID-19 cases analyzing CT images with objective image metrics. Future improvements of the methodology could help the radiologists and clinicians to reduce the workload and for an optimized final clinical decision.
Compliance with Ethical Standards
Ethics and approval and Consent to participate: Not applicable.
Consent of Publication: Not applicable.
Conflict of Interests: Authors declare no conflict of interests.
Authors’ contributions: FA - designed the algorithm, analyzed the data, and wrote the manuscript. IE - processed the dataset.
References- Gorbalenya AE, Baker SC, Baric RS, J. de Groot R, Drosten C, et al. (2020) Severe acute respiratory syndrome-related coronavirus: The species and its viruses – a statement of the Coronavirus Study Group. Nature Microbiol 5: 536-544.
- Hui D, Azhar E, Madani T, Ntoumi F, Kock R, et al. (2020) The continuing 2019-nCoV epidemic threat of novel coronaviruses to global health – The latest 2019 novel coronavirus outbreak in Wuhan, China. Int J Infect Dis 91: 264-266.
- Matthay M, Aldrich J, Gotts J (2020) Treatment for severe acute respiratory distress syndrome from COVID-19. The Lancet 8(5): 433-434.
- Foerch C, Friedauer L, Bauer B, Wolf T, Adam EH (2020) Severe COVID-19 infection in a patient with multiple sclerosis treated with fingolimod. Mult Scler Relat Disord 6(42): 102180.
- Gattinoni l, Chiumello D, Caironi P, Busana M, Romitti F, et al. (2020) COVID-19 pneumonia: different respiratory treatments for different phenotypes? Intensive Care Med 46: 1099-1102.
- Luo P, Liu Y, Qui L, Liu X, Liu D, et al. Tocilizumab treatment in COVID-19: A single center experience. J Med Virol 92(7): 814-818.
- Brown B, McCullough J (2020) Treatment for emerging viruss: Convalscent plasma and COVID-19. Transfus Apher Sci 59(3): 102790.
- Okour M, Al-Kofahi M, Austin D (2020) Hydroxychloroquine and azithromycin as potential treatments for COVID-19; clinical status impacts the outcome. J Pharmacokinet Pharmacodyn 47(3): 187-188.
- Yang L, Tian D, Liu W (2020) Strategies for vaccine development of COVID-19. Sheng Wu Gong Cheng Xue Bao 36(4): 593-604.
- Merza MA, Haleem Al Mezori AA, Mohammed HM, Abdulah DM (2020) COVID-19 outbreak in Iraqi Kurdistan: The first report characterizing epidemiological, clinical, laboratory, and radiological findings of the disease. Diabetes Metab Syndr 14(4): 547-554.
- Páez-Granda D, Chicaiza M, Calle G, et al. (2020) Diagnosis of patients with suspected COVID-19: What is the role of chest CT? Med Clin (Barc.) S0025-7753(20)30214-1.
- T. Ai, Z. Yang, H. Hou, et al. (2020) Correlation of Chest CT and RT-PCR Testing in Coronavirus Disease 2019 (COVID-19) in China: A Report of 1014 Cases. Radiol 296(2).
- Duan Y, Zhu Y, Tang L, et al. (2020) CT features of novel coronavirus pneumonia (COVID-19) in children. Eur J Radiol 127: 104377.
- Wu X, Hui H, Niu M (2020) Deep learning-based multi-view fusion model for screening 2019 novel coronavirus pneumonia: A multicentre study. Eur J Radiol 128: 109041.
- Roy S, Menapace W, Oei S (2020) Deep learning for classification and localization of COVID-19 markers in point-of- care lung ultrasound. IEEE Trans Med Imag.
- Barbosa J, Ramos J, Lima CS (2008) Detection of small boweltumors in capsule endoscopy frames using texture analysis based onthe discrete wavelet transform. Engineering in Medicine and Biology Society, 30th Annual International Conference of the IEEE. 3012-3015.
- Arguelles-Arias F, Rodrıguez-Oballe J, Duarte-Chang C, et al. (2014) Capsule endoscopy in the small bowel crohns disease. Gastroenterol Res Pract 2014.
- He X, Yang X, Zhang S, et al. (2020) Sample-efficient Deep Learning for COVID-19 Diagnosis Based on CT scans” Medrxiv.
- Ren X, Malik J (2003) Learning a classification model for segmenta-tion. Int Conf Comp Vision 10-17.
- Amraoui AE, Masmoudi L, Ez-Zahraouy H, Amraoui YE (2016) Quantum edge detection based on SHANNON entropy for medical images," IEEE/ACS 13th International Conference of Computer Systems and Applications (AICCSA), Agadir 1-6.
- Schielein R, Schöpfer S, Kiunkel M, et al. (2014) Quantitative evaluation of CT Images by means of Shannon Entropy. 11th European Conference on Non-Destructive Testing.