


Rampukar Sah*
Clinical Psychologist, Child and Adolescent Psychiatry Unit, Kanti Children’s Hospital
*Corresponding Author: Rampukar Sah, Clinical Psychologist, Child and Adolescent Psychiatry Unit, Kanti Children’s Hospital.
Abstract
Background: Medical education is highly stressful, stepping into a new environment, and a huge course syllabus which has to be mastered in a short period of time, besides continuous assessments, examinations, and other social and personal issues make medical student prone to develop negative emotional symptoms.
Objective: This study aims to assess the level of stress, level of anxiety, and level of depression and its associated risk factors.
Materials and Methods: A cross-sectional study was conducted on 198 medical students from the 1st of January 2016 to the 1st of January 2017 at Tribhuvan University Teaching Hospital (TUTH), Kathmandu. Semi structured proforma and Depression, Anxiety and stress Scale - 21 Items (DASS-21) were used to collect the data. Ethical approval was sought from the Institutional Review Board, Institute of Medicine, Tribhuvan University Teaching Hospital.
Results: The study reported 32.8% (N=65) of the participants had significant level of stress and anxiety, whereas 34.8 % (N=69) reported depression of mild to extreme level. Study reported that anxiety increases significantly with increase in intake of alcohol. Study showed that female had higher Stress and anxiety than male.
Conclusion: Overall findings suggest that almost one-third of medical students reported significant symptoms of stress, anxiety, and depression. Stress identification and its management should not be overlooked by medical students to ensure their well-being and better mental health.
Keywords: Anxiety, Depression, Postgraduate medical students, Stress
Introduction
Health professionals have a huge responsibility in providing proper health services. However, findings from studies of medical students and young doctors suggest that their own health care is poor [1]. Reports show high rate of mental health problem including depression, and anxiety in health professionals [2]. According Ministry of health and population of Nepal, Nepal was found to have 0.17 doctors per 1,000/population and 0.50 nurses per 1,000/population. This represents 0.67 doctors and nurses per1,000/population, which is significantly less than the WHO recommendation of 2.3 doctors, nurses and midwives per 1,000/population. The demand is higher for medical professionals, whereas their numbers are low, which increases their level of stress, anxiety and resulting into depression [3,4]. Medical education is highly stressful, stepping into a new environment, huge course syllabus which has to be mastered in a short period of time besides continuous assessments, examinations and other social and personal issues makes medical student prone to develop negative emotional symptoms [9]. The prevalence of anxiety disorder was 35.1% found in a Pakistani and 39.9% from Indian study [5,6]. Studies from western world reports prevalence rate of anxiety in the range of 14–24% for health professionals. [7,19] Whereas eastern countries like Pakistan, Malaysia and Singapore shows prevalence of 46.1%, 41.9% and 57.0% of anxiety and depressive disorder [8,9,10]. Patti et al reported that 37.0% of the medical professional has the symptoms of anxiety [11]. The prevalence of depression of medical students were 35.1% in a Pakistani and 39.9% from Indian study [5,6]. Prevalence of stress was 27.0% in medical students in a study from turkey. However, study from Nepal had 73.0% of prevalence of stress, Brazil had 40.2%, and Iran had 44.0% and Malaysia had41.9% students having Stress during the medical college [l1,12,13].
Methodology
A cross-sectional study was conducted at Tribhuvan University Teaching Hospital (TUTH), Kathmandu, Nepal, aiming to assess stress, anxiety, and depression levels among 300 postgraduate medical students. The research utilized a census sampling method, enrolling all eligible participants except those previously diagnosed with depression/anxiety and Information Technology master's students.
Participants completed self-reporting questionnaires, including socio-demographic details and the Depression Anxiety stress Scale (DASS), a 21-item measure developed by Lovibond and Lovibond (1995). Institutional Review Board approval was obtained from the Institute of Medicine, Tribhuvan University, and Teaching Hospital. Statistical analysis was performed using SPSS version 21 for Windows, presenting results as mean ± standard deviation, percentages with 95% confidence intervals, and significant associations determined by chi-square tests (p<0.05). Binary logistic correlation examined the strength of associations between independent and dependent variables. The study aimed to identify the prevalence of risk and protective factors linked to Stress, anxiety, and depression among postgraduate medical students.
Ethical Approval
Ethical approval was sought from the Institutional Review Board, Institute of Medicine, Tribhuvan University Teaching Hospital.
Results
Table No. 1: Socio- Demographic Characteristics of the participants (N=198)
|
Characteristic |
Categories |
No. of Participants (N) |
Percent (%) |
|
Gender |
Male Female |
107 91 |
54 46 |
|
Age Group(years) |
20-30 31- 40 41-50 |
152 44 2 |
76.8 22.2 1 |
|
Place of Residency |
Rural Urban |
33 165 |
16.7 83.3 |
|
Marital status |
Single Married |
97 101 |
49 51 |
|
Religion |
Hindu Buddhist Islam Christian Others |
174 13 7 1 3 |
87.9 6.6 5.5 0.5 1.5 |
|
Type of Family |
Nuclear Joint |
119 79 |
60.1 39.9 |
|
Income |
5000- 10000 11000- 15000 16000-20000 21000-25000 More than 25000 |
15 5 3 15 160 |
7.6 2.5 1.5 7.6 80.6 |
|
Number of family |
Less than five More than five |
111 87 |
63.1 43.9 |
|
Residency Year |
First Year Second Year Third Year |
87 67 44 |
44 33.4 22.2 |
|
Use of Alcohol |
No use of alcohol Occasional drinking Less than 2 Year 2-5 Year of Drinking More than five year of Drinking |
126 19 10 10 33 |
63.6 9.6 5.1 5.1 16.6 |
|
Ethnicity |
Brahmin Chhetri Newar Tamang Gurung Magar Others |
78 36 43 1 3 2 35 |
39.4 18.6 21.7 0.5 1.5 1 17.7 |
|
Type of department |
Surgical Non- Surgical |
43 155 |
21.7 78.3 |
|
Use of Substance |
Using Not Using |
19 179 |
9.5 90.5 |
The study enrolled a total of 198 postgraduate medical students with the response rate of 66% where majority were males (54%) than females (46%). Majority (76.8%) were from 18- 30 years of age group, whereas 22.2% were from age group of 30-40 years and only 1 % were from age group of 40-50 years, from urban area (83.3%), married(51%), belonged to nuclear family (60.1%) and Hindu religion(87.9%), (had monthly income of more than twenty-five thousand were (80.8%), from non-surgical department (78.3%) and were not consuming alcohol(63.6%). However, about one-third (36.4%) were consuming alcohol. About one-tenth (9.5%) were using substance. Most the participants were from first year of residency (43.9%) while (33.8%) were from second year Also, most of them had family member less than five (56.11%) ,and from Brahmin ethnicity(39.4% ).
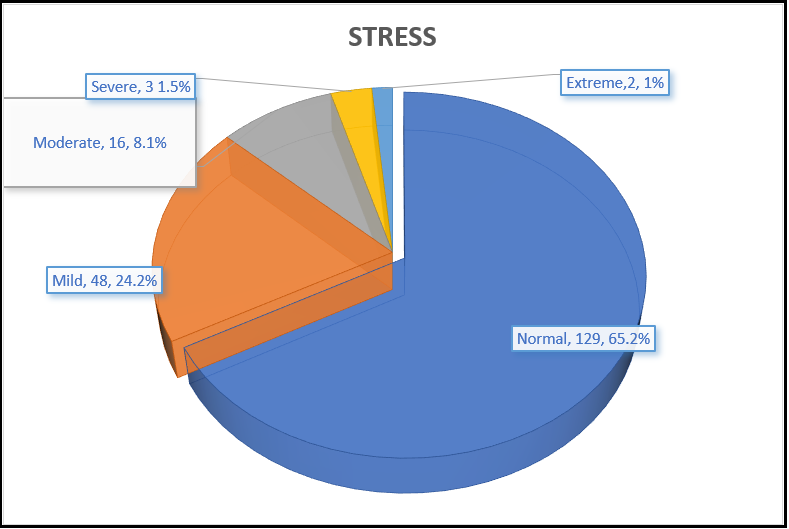
Figure 1: Stress among the Participants
Figure one reported that 24.2% (N= 48) had mild level of stress were, moderate level of stress were among 8.1% (N= 16), severe level of stress were among 1.5% (N= 3) and extreme level of stress were among 1% (N=2).
Table No. 2: Stress and Socio- demographic Variables
|
Characteristics
|
Category
|
Mean ± S. D |
Stress |
Chia Square Test (X2 ) |
||
|
Normal |
Clinical range |
|
||||
|
Gender |
Male Female |
(9.7 ± 7) (9.1 ± 7) |
67(62.5%) 62(68%) |
40(37.5) 29(32%) |
2.2 |
|
|
Age Group |
20-30 31- 40 41-50 |
(9.7 ± 6.9) (8.5 ± 7.2 ) (6 ± 8.4) |
97(63%) 30(68%) 2(100%) |
55(36%) 13(29%) 0(0%) |
2.4 |
|
|
Place of Residency |
Rural Urban |
(9.7 ± 6.9) (9.4 ± 7) |
22(66%) 107(64%) |
11(33%) 58(35%) |
1.2 |
|
|
Marital status |
Single Married |
(10.4 ± 6.8) (8.4 ± 7.1) |
59(61%) 70(69%) |
38(39%) 31(31%) |
2.1 |
|
|
Religion |
Hindu Buddhist Islam Christian Others |
(9.3 ± 6.8) (10.8 ± 9.6) (11 ± 8.1) (10 ± 0) (4.6 ± 3) |
112(64%) 9(69%) 4(36%) 1(1%) 3(1%) |
62(36%) 4(31%) 3(27%) 0(0%) 0(0%) |
25.7
|
|
|
Type of Family |
Nuclear Joint |
(9.3 ± 6.2) (9.6 ± 8.1) |
76(64%) 53(67%) |
43(36%) 26(33%) |
2.01 |
|
|
Income |
5000- 10000 11000- 15000 16000-20000 21000-25000 >25000 |
(8.2 ± 5.8) (6.8 ± 4.3) (4 ± 4) (10.4 ± 6.6) (9.6 ± 7.2) |
11(73%) 3(6%) 3(1%) 9(6%) 103(64%) |
2(13%) 2(4%) 0(0%) 9(6%) 57(35%) |
6.88 |
|
|
Number of family |
Less than five More than five |
(9.6± 6.3) (9.2 ± 7.8) |
68(61%)
|
43(39%) 36(41%) |
3.43 |
|
|
Residency Year |
First Year Second Year Third Year |
(9 ± 7.1) (10.1 ± 6.8) (9.1 ± 7.3) |
57(56%) 43(64%) 29(65.9) |
30(30%) 24(36%) 15 (34.1%) |
4.01 |
|
|
Use of Alcohol |
No use Occasional < 2 Year 2-5 Year > 5 Year |
(8.8 ± 6.1) (10.2 ± 8.2) < 2 Year (11 ± 5) (12.6 ± 9.6) (9.9 ± 8.8) |
84(67%) 13(68%) 6(54%) 7(7%) 10(30%) |
42(33%) 6(31%) 4(36%) 3(3%) 14(42%) |
17.14 |
|
|
Ethnicity |
Brahmin Chhetri Newar Tamang Gurung Magar Others |
(9 ± 7) (9.9 ± 6.5) (9.2 ± 6.5) (8 ± 0) (14.6 ± 17) (13 ± 7) (9.5 ± 7.3) |
52(67%) 22(61%) 27(63%) 1(100%) 2(67%) 1(50%) 24(68%) |
26 (33%) 14 (29%) 16 (37%) 0 (0) 1(33%) 1(50%) 11(32%) |
30.33 |
|
|
Type of department |
Surgical Non- Surgical |
(9.7 ± 5.9) (9.3 ± 7.3) |
21(49%) 108(70%) |
22(51%) 47(30%) |
10.7* (p<0.03) |
|
|
Use of Substance |
Using Not Using |
(12.4 ± 9.7) (9.1 ± 6.6) |
12(63%) 117(99%) |
7(37%) 62(35%) |
10.1* (p<0.02) |
|
Note: * = P value is less than 0.05,
The above table result showed that surgical department residents (51%) had more stress than that of non - surgical department (30%, P-value 0.03) and it was significant. Similarly, participants who used substance (37%) had higher stress than who did not use substance (35%) and it was significant too with P-value of 0.02.
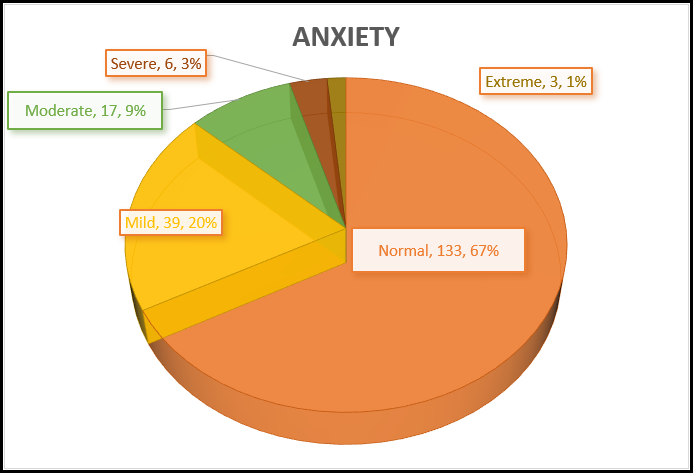
Figure 2: Anxiety among Participants
Results showed that participants who had mild level of anxiety were 19.7% (N= 39), moderate level of anxiety were 8.6% (N= 17), severe level of anxiety were 3% (N= 6), extreme level of anxiety were 1.5% (N= 3) and 67.2 % (N= 133) (see table 2) were in normal level of anxiety.
Table No 3: Anxiety and Socio- demographic Variables
|
Characteristics |
Category |
Mean and S.D |
Anxiety |
X2 |
||
|
Normal |
Clinical |
|
||||
|
Gender |
Male Female |
(9.7 ± 7) (9.1 ± 7) |
75(71.4%) 58(63.7%) |
32(28.6%) 33(36.3%) |
4.6 |
|
|
Age Group |
20-30 31- 40 41-50 |
(9.7 ± 6.9) (8.5 ± 7.2) (6 ± 8.4) |
105(69%) 26(59%) 2(100%) |
47(31%) 18(41%) 0 |
4.0 |
|
|
Place of Residency |
Rural Urban |
(9.7 ± 6.9) (9.4 ± 7) |
23(69.6%) 110(66.6%) |
10(30.4%) 55(33.4%) |
2.4 |
|
|
Marital status |
Single Married |
(, 10.4 ± 6.8) (8.4 ± 7.1) |
67(69%) 66(65.1%) |
30(31%) 35(34.9%) |
2.6 |
|
|
Religion |
Hindu Buddhist Islam Christian Others |
(, 9.3 ± 6.8) (10.8 ± 9.6) (11 ± 8.1) (10 ± 0) (4.6 ± 3) |
121(69.5%) 6(48%) 3(27.2%) 1(100%) 2(66.6%) |
53(29.5%) 7(52%) 4(61.8%) 0 1(33.4%) |
10.7 |
|
|
Type of Family |
Nuclear Joint |
(9.3 ± 6.2) (9.6 ± 8.1) |
80(67.2%) 53(76.8%) |
39(32.8%) 26( 22.2%) |
1.4 |
|
|
Income |
5000- 10000 11000- 15000 16000-20000 21000-25000 >25000 |
(8.2 ± 5.8) (6.8 ± 4.3) (4 ± 4) (10.4 ± 6.6) (9.6 ± 7.2) |
10(67%) 5(1%) 2(67%) 7(47%) 109(68%) |
5(33%) 0(0%) 1(33%) 8(53%) 51(32%) |
17.9 |
|
|
Number of family |
Less than five More than five |
(9.6± 6.3) (9.2 ± 7.8) |
72(65%) 61(70%) |
39(35%) 26(30%) |
2.7 |
|
|
Residency Year |
First Year Second Year Third Year |
(9 ± 7.1) (10.1 ± 6.8) (9.1 ± 7.3) |
56(55%) 48(72%) 29(65.9%) |
31(31%) 19(28%) 15 (34.1%) |
|
|
|
Use of Alcohol |
No use Occasional < 2 Year 2-5 Year > 5 Year |
(8.8 ± 6.1) (10.2 ± 8.2) (11 ± 5) (12.6 ± 9.6) (9.9 ± 8.8) |
87(69%) 12(63%) 4(36%) 9(90%) 21(64%) |
39(31%) 7(37%) 0(0%) 1 (10%) 12(2%) |
30.8*(p<0.04) |
|
|
Ethinicity |
Brahmin Chhetri Newar Tamang Gurung Magar Others |
(9 ± 7) (9.9 ± 6.5) (9.2 ± 6.5) (8 ± 0) (14.6 ± 17) (13 ± 7) (9.5 ± 7.3) |
52(67%) 27(75%) 27(63%) 1(1%) 2(67%) 24(12%) |
26(33%) 9(25%) 16(37%) 0(0%) 1(33%) 2(1%) 11(31%) |
38.1 |
|
|
Type of department |
Surgical Non- Surgical |
(9.7 ± 5.9) (9.3 ± 7.3) |
28(65%) 105(68%) |
15(35%) 50(32%) |
7.1 |
|
|
Use of Substance |
Using Not Using |
(12.4 ± 9.7) (9.1 ± 6.6) |
15 (79%) 118 (66%) |
4 (21%) 61 (34%) |
5.2 |
|
Note: * = P value is less than 0.05,
The table showed that anxiety have significant relation with alcohol but not with any other socio- demographic variables None-alcohol consuming (30.9%) and who consumed (36.8%) and it was significant since P-value was 0.02.
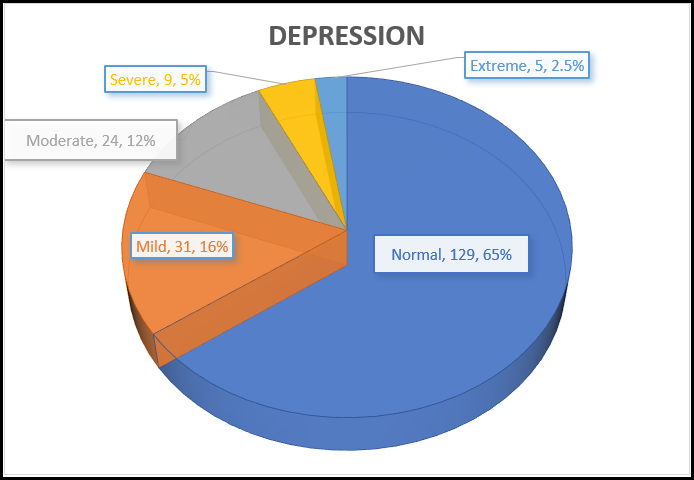
Figure 3: Depression among Participants
Figure represented that participants who had mild level of depression were 15.2% (N= 31), moderate level of depression were 12.1% (N= 24), severe level of depression were 4.5% (N= 9), extreme level of depression were 2.5% (N= 5) and 65.2% (N= 129) were in normal level of depression were. The mean score was 7.47 and the standard deviation was 7.54.
Table No. 4: Depression and Socio- demographic Variables
|
Characteristics |
Category |
Mean and SD score |
Depression |
X2 |
|
|
Normal |
Clinical |
|
|||
|
Gender |
Male Female |
(9.7 ± 7) (9.1 ± 7) |
67(62.6%) 62(68.1%) |
40(37.4%) 29(31.9%) |
5.63 NS |
|
Age Group |
20-30 31- 40 41-50 |
(9.7 ± 6.9) (8.5 ± 7.2) (6 ± 8.4) |
102(67.1%) 25(56.8%) 2(100%) |
50(32.9%) 19(43.2%) 0 |
8.9 NS |
|
Place of Residency |
Rural Urban |
(9.7 ± 6.9) (9.4 ± 7) |
19(57.5%) 129(78.1%) |
14(32.5%) 55(21.9%) |
5.2 NS |
|
Marital status |
Single Married |
(, 10.4 ± 6.8) (8.4 ± 7.1) |
61(62.8%) 68(67.3%) |
36(37.2%) 33(32.7%) |
2.3 NS |
|
Religion |
Hindu Buddhist Islam Christian Others |
(, 9.3 ± 6.8) (10.8 ± 9.6) (11 ± 8.1) (10 ± 0) (4.6 ± 3) |
113(64.9%) 9(69.2%) 7(63.6%) 1(100%) 3(100%) |
61( 35.1%) 4(29.8%) 4(36.4%) 0 0 |
16.8 NS |
|
Type of Family |
Nuclear Joint |
(9.3 ± 6.2) (9.6 ± 8.1) |
80 (67.2%) 49 (71.1%) |
39(32.8%) 30(28.1%) |
4.6 NS |
|
Income |
5000- 10000 11000- 15000 16000-20000 21000-25000 >25000 |
(8.2 ± 5.8) (6.8 ± 4.3) (4 ± 4) (10.4 ± 6.6) (9.6 ± 7.2) |
12(80%) 3(60%) 3(100%) 7(49%) 104(65%) |
3(20%) 2(40%) 0 8(51%) 56(935%) |
15.4 NS |
|
Number of family |
Less than five More than five |
(9.6± 6.3) (9.2 ± 7.8) |
73(65.7%) 56(64.3%) |
38(34.3%) 31( 35.7%) |
1.2 NS |
|
Residency Year |
First Year Second Year Third Year |
(9 ± 7.1) (10.1 ± 6.8) (9.1 ± 7.3) |
55(63.2%) 45(67.1%) 29(64.9%) |
32(36.8%) 22(32.9%) 15(35.1%) |
5.4 NS |
|
Use of Alcohol |
No use Occasional < 2 Year 2-5 Year > 5 Year |
(8.8 ± 6.1) (10.2 ± 8.2) (11 ± 5) (12.6 ± 9.6) (9.9 ± 8.8) |
86(68.2%) 11(57.8%) 6(60%) 7(70%) 19(57.5%) |
40(31.8%) 8(42.2%) 4(40%) 3(30%) 14 (42.5%) |
8.2 NS |
|
Ethnicity |
Brahmin Chhetri Newar Tamang Gurung Magar Others |
(9 ± 7) (9.9 ± 6.5) (9.2 ± 6.5) (8 ± 0) (14.6 ± 17) (N=2,13±7) ( 9.5 ± 7.3) |
48(68.5%) 26(72.2%) 30(69.7%) 1(91.00%) 2(66.6%) 1(50%) 21(60%) |
30(31.6%) 10(27.8%) 13(29.3%) 0 1(33.4%) 1(50%) 14(40%) |
23.4 NS |
|
Type of department |
Surgical Non- Surgical |
( 9.7 ± 5.9) (9.3 ± 7.3) |
29(67.5%) 100(65.5%) |
14(32.5%) 55(34.5%) |
4.3 NS |
|
Use of Substance |
Using Not Using |
(12.4 ± 9.7) (9.1 ± 6.6) |
10(53%) 119(66.5%) |
8(47%) 60(33.5%) |
6.09 NS |
Note: * = P value is less than 0.05, NS= Not Significant
The table showed that depression did not have any significant relation with socio- demographic variables.
Correlations between Stress, Anxiety, Depression
|
Measures |
Stress |
Anxiety |
Depression |
|
Stress |
1 |
0.59** (P <0.0) |
0.73**(P <0.0) |
|
Anxiety |
0.59**(P <0.0) |
1 |
0.64**(P <0.0) |
|
Depression |
0.73**(P <0.0) |
0.64**(P <0.0) |
1 |
Note: ** = p<0.01
The table shows that all the variables have positive correlation with each other.
Discussion
36.4% were consuming alcohol which contrasts with the study of Pullen et al (1995) which shows only 3% alcohol problems in his participants [14]. Similarly, according to Patrick et al. (2016), substantial rates of behavioral health problems were found, with 20.6% screening positive for hazardous, harmful, and potentially alcohol-dependent drinking in the study done [15]. Study done by Khanal. P et al (2010) found the 57.6% prevalence of alcohol among graduate level postgraduate medical students [16]. The respondents who were using substance in the present study were 9.5%, which is almost similar in pattern reported by Khanal. P et al (2010), who reported prevalence as 12.6% [16].
Overall, 34.8 % of subjects had stress. This finding contrasted with the findings of Marjani et al (2008) who reported mild, moderate, and severe stress of 26.22%, 20.50% and.75% among the study subjects [14] and 39.35% of medical students had no stress [17]. Stress was found to be higher in males than female postgraduate medical students and it was even higher in age group of 20- 30 years compared to other age group. It was higher in single than married postgraduate medical students. Stress in female was like that of the study done in Turkey, where female students experienced a higher level of stress than male students according to Khamseh et al (2011) [22]. The result was like Priya et al (2015) where the stress scores were significantly different in stressed state in male and female students [19].
Overall, 32.8% of the total participants had anxiety, which was lower than the finding of Kunwar et al. (2016) where their findings showed the prevalence of anxiety was 41.1% [20]. The prevalence of anxiety from this study is also in line with findings 35.1% in a Pakistani and 39.9% from Indian study [5,6]. Studies from western world report prevalence rates of anxiety in the range of 14–24% [7,19]. Greenfield et al. (2000) show that female medical students experienced considerably more anxiety than male students in clinical settings [19].
Overall, 34.8% of them had depression and depression was higher in male than female. The results were higher than the finding of Kunwar et al (2016), where their findings show the prevalence of depression was 29% [20]. Another study from done by Basnet et al (2012) from Dharan, Nepal found the prevalence of depression to be 29.78%. Similarly, another study from Nepal showed the prevalence of 20% [18,21]. The prevalence of depression (34.8%) from this study is also in line with findings 35.1% in a Pakistani and 39.9% from Indian study [5,6]. Study from Pakistan, Malaysia medical university and Singapore shows prevalence of 46.1 41.9%, and 57.0% had depression [8-10]. Patti et al. (2007) reported that 37.0% of the medical professional have the symptoms of depression [11].
Depression was higher in those using substance. Being a health professional is a huge responsibility, studies of medical students and young doctors suggest that their own health care is poor [1], reports show high rates of mental health problems including depression, anxiety [2].
Study reported that stress, anxiety and depression had strong correlation among each other [19,22].
Limitations
Study did not investigate the timeline like yearly i.e first year, second year and final year due to limitation of time duration to complete the research. Study didn’t include medical students below 25 years of age and above 50 years of age which would leave the research with huge age range gap.
Conclusion
Medical education is highly stressful which makes post graduate medical student prone to develop negative emotional symptoms. Overall findings suggest that almost one third medical students reported significant symptoms of stress, anxiety and depression. Stress identification and its management should not be overlooked in medical students to ensure their well-being and better mental health.
Acknowledgement: None.
Conflict Of Interest: None.
References
- Baldwin P, Dodd M, Wrate RM (1997) Young doctors' health-II. Health and health behaviour. Soc Sci Med. 45(1): 41–44.
- Kroenke K, Spitzer RL, Williams JB, Monahan PO, Löwe B (2007) Anxiety Disorders in Primary Care: Prevalence, Impairment, Comorbidity, and Detection, Annals of Internal Medicine. 146(5): 317-25.
- Tam CW, Pang EP, Lam LC, Chiu HF (2004) Severe acute respiratory syndromr4.,mgd;ae (SARS) in Hong Kong,: stress and psychological impact among frontline healthcare workers. Psychol. Med. 34(7): 1197–1204.
- Styra R, Hawryluck L, Robinson S, Kasapinovic S, Fones C, et al. (2008) Impact on health care workers employed in high-risk areas during the Toronto SARS outbreak. J. Psychosom. Res. 64(2): 177–183.
- Alvi T, Assad F, Ramzan M, Khan FA (2010) Depression, Anxiety and Their Associated Factors Among Medical Students. Journal of the College of Physicians and Surgeons Pakistan. 20(2): 122-126.
- Vaidya PM, Mulgaonkar KP (2007) Prevalence of depression, anxiety and stress in undergraduate medical students and its correlation withtheir academic performance. Indian J of Occup Ther. 39: 7-10.
- Goebert D, Thompson D, Takeshita J, Beach C, Bryson P, et al. (2009) Depressive symptoms in medical students and residents: a multi school study. Acad Med. 84(2): 236-241.
- Jadoon NA, Yaqoob R, Raza A, Shehzad MA, Zeshan SC (2010) Anxiety and depression among medical students: A cross- sectional study. J Pak Med Assoc. 60(8): 699-702.
- Sidik SM, Rampal L, Kaneson N (2003) Prevalence of emotional disorders among medical students in a Malaysian university. Asia Pacific Family Medicine. 2(4): 213–217.
- Khan MS, Mahmood S, Badshah A, Ali SU, Jamal Y (2006) Prevalence of depression, anxiety and their associated factors among medical students in Karachi, Pakistan. J Pak Med Assoc. 56(12): 583-6.
- Patti E, Acosta J, Chavda A, Verma D, Marker M, et al. (2007) Prevalence of Anxiety and Depression Among Emergency Department Staff. New York Medical Journal. 21(3): 321-7.
- Sherina MS, Rampal L, Kaneson N (2004) Psychological stress among undergraduate medical students. Med J Malaysia. 59(2): 207-11.
- Abramova T, Ogunfowora OT, Ogunji AO, Agrawal A (2015) Assessment of Depression and Stress among Medical Students from Three Different Countries: Nepal, Ukraine and Russia: A Cross-Sectional Survey. International J of Preventive and Public Health Sci. 1(2): 9-13.
- Lisa M.P (1994) The Relationships Among Alcohol Abuse in College Students and Psychological/Demographic Variables. Journal of Alcohol and Drug Education. 40(1): 36-50.
- Krill PR, Johnson R, Albert L (2016) The Prevalence of Substance Use and Other Mental Health Concerns Among American Attorneys, Journal of Addiction Medicine. 10(1): 46- 52.
- Khanal P, Ghimire RH, Gautam B, Dhungana SK, Parajuli P, et al. (2010) Substance Use among Medical Students in Kathmandu Valley. JNMA J Nepal Med Assoc. 50(180): 267-72.
- Marjani A, Gharavi AM, Jahanshahi M, Vahidirad A, Alizadeh F (2008) Stress among medical students of Gorgan (South East of Caspian Sea), Iran. Kathmandu University Medical Journal. 6(23): 421-425.
- Basnet B, Jaiswal M, Adhikari B, Shyangwa PM (2012) Depression among Undergraduate Medical Students. Kathmandu Univ Med J. 39(3): 56-9.
- Greenfield S, Parle J, Holder R (2001) The anxieties of male and female medical students on commencing clinical studies: the role of gender. Educ Health (Abingdon). 14(1): 61-73.
- Kunwar D, Risal A, Koirala S (2016) Study of depression, anxiety and stress among the medical students in two medical colleges of nepal. Kathmandu Univ Med J. 53(1): 22-6.
- Sreeramareddy CT, Shankar PR, Binu VS, Mukhopadhyay C, Ray B, et al. (2007) Psychological morbidity, sources of stress and coping strategies among undergraduate medical students of Nepal. BMC Med Educ. 7: 26.
- Khamseh F, Rouhi H, Ebady A, Hajiamini Z, Salimi H, et al. (2011) Survey relationship between demographic factors and stress, anxiety and depression in nurses working in selected hospitals in Tehran city. Holistic Nursing and Midwifery. 21(1): 13-21.
- Lovibond SH, Lovibond PF (1995) Manual for the Depression Anxiety & Stress Scales. (2nd Ed.)Sydney: Psychology Foundation.