


Aleksander Dokollari MD, PhD1,6*, Serge Sicouri, MD1, Yoshiyuki Yamashita MD1, Rakesh C Arora MD, PhD5, Nitin Ghorpade MD6, Stephanie Kjelstrom, MPH, CPH3, Georgia Montone, MS3, Francesco Cabrucci MD4, Beatrice Bacchi MD4, Bruno Chiarello MD4, Massimo Bonacchi MD4, Ali Fatehi Hassanabad MD7, Marco Gemelli MD8, Basel Ramlawi, MD, FRCSC, FACC, FACS1,2, MaryAnn Wertan RN, Francis P. Sutter, DO, FACS, FACOS2
1Department of Cardiac Surgery Research, Lankenau Institute for Medical Research, Main Line Health, Wynnewood, Pennsylvania, USA.
2Department of Cardiac Surgery, Lankenau Heart Institute, Lankenau Medical Center, Main Line Health, Wynnewood, Pennsylvania, USA.
3Main Line Health Center for Population Health Research, Lankenau Institute for Medical Research, Wynnewood, Pennsylvania, USA.
4Department of Experimental and Clinical Medicine, University of Florence, Florence, Italy.
5Case Western University Hospital, Cleveland Clinic, Cleveland, Ohio, USA.
6St. Boniface Hospital, University of Manitoba, Winnipeg, MB, Canada.
7Libin Cardiovascular Institute, University of Calgary, Calgary, AB, Canada.
8Cardiac Surgery Department, University of Padua, Padua, Italy.
*Corresponding Author: Aleksander Dokollari MD, PhD, Department of Cardiac Surgery Research, Lankenau Institute for Medical Research, Main Line Health, Wynnewood, Pennsylvania, USA, St. Boniface Hospital, University of Manitoba, Winnipeg, MB, Canada.
Abstract
Objective: We aim to identify periprocedural risk predictors that influence long-term prognosis in patients with chronic kidney disease (CKD) undergoing isolated coronary artery bypass grafting (CABG).
Methods: All consecutive 4,871 patients undergoing isolated CABG between May 2005 and June 2021 were included in the study. Patients with and without CKD were compared for baseline demographics and pre-operative characteristics. A propensity-adjusted analysis was used to compare the two groups. The primary outcome was the long-term incidence of all-cause death. The secondary outcome was major adverse cardiovascular and cerebrovascular events (MACCE).
Results: 1,452 patients were included in the CKD group and 3,419 in the non-CKD group. Postoperatively, CKD patients had a higher incidence of blood product transfusion, new atrial fibrillation, acute renal failure, postoperative intensive care unit, and hospital length of stay. 30-day all-cause mortality and all-cause hospital readmission were higher in CKD patients. The mean follow-up time was 4 years. All-cause death was 297 (20.4%) vs 266 (7.8%), p<0.001, (HR 1.5 [1.2, 1.9]) in patients with and without CKD. MACCE did not differ among the two groups. Periprocedural risk predictors for all-cause mortality in the CKD cohort were male sex, white race, dialysis, hypertension, and atrial fibrillation.
Conclusion: Patients with CKD undergoing isolated CABG had a significantly higher incidence of all-cause mortality compared to those without CKD. Herein, we provide risk predictors of all-cause mortality in CKD patients.
Keywords: CKD; CAD; CABG; Risk factors; Survival; MACE
Introduction
Chronic kidney disease (CKD) patients are at increased risk of developing obstructive coronary artery disease (CAD), myocardial infarction (MI), cardiac death [1], and procedural complications including stroke, infection, major bleeding, and coronary artery dissection [2-3]. As the glomerular filtration rate (GFR) declines below 60 to 75 ml/min/1.73 m2, the probability of developing CAD increases exponentially [4]. However, clinical trials, including the Fractional Flow Reserve versus Angiography for Multivessel Evaluation (FAME 2) clinical trial [5], the Bypass Angioplasty Revascularization Investigation 2 Diabetes (BARI 2D) [6] clinical trial, and Clinical Outcomes Utilizing Revascularization and Aggressive Drug Evaluation (COURAGE) clinical test [7] excluded or reduced at ˂ 2% the number of patients with CKD. In this context, the short- and intermediate-term outcomes in the EXCEL clinical trial, after revascularization of complex CAD, are worse in patients with CKD compared with patients without CKD [8]. In addition, the ISCHEMIA-CKD clinical trial [9] failed to demonstrate its primary and secondary end-points.
While standard guidelines define CKD as a modifying risk factor [10], the predicted risk of CKD patients is lower than the observed risk, and this underestimation is not uniform [11]. Additional risk markers may help to refine cardiovascular disease risk estimates when the benefits and risks of treatment are uncertain [11]. In this context, risk prediction of patients with CKD undergoing CABG is of paramount importance. Therefore, we investigated the risk factors associated with CKD in CAD patients.
The main goal of this manuscript is to identify risk factors that influence long-term clinical outcomes in patients with CKD and CAD undergoing CABG.
Methods
Patient's Identification and Inclusion Criteria
Study population
We identified all patients who underwent CABG between May 2005 and June 2021 at Lankenau Heart Institute (Lankenau Medical Center, PA, USA). The study protocol was approved by the Main Line Health Hospitals Institutional Review Board (IRB 45CFR164.512). All consecutive patients who underwent isolated CABG were included in the study. Patients with a concomitant procedure were excluded from the study. Patients were identified via operation codes in a digital operation registry and from a centralized cardiac surgery database for all isolated CABG operations. In this database, the underlying in-hospital outcomes were recorded from the charts and death certificates made out by the responsible doctor. Follow-up was done at our outpatient clinic and from the hospital registry. In our center, eleven surgeons performed CABG in the study timeframe.
Primary and Secondary Goals and Definitions
The primary outcome was an analysis of all causes of death and MACCE in CKD patients after isolated CABG. Secondary goals were non-fatal stroke, non-fatal myocardial infarction (MI), and reintervention as discrete events on the composite. CKD patients had a creatinine clearance of < 60 ml/min/1.73 m2, while non-CKD patients had a creatinine clearance of≥ 60 ml/min/1.73 m2. CKD and non-CKD patients were compared by all demographics and pre-operative characteristics. All other variables were defined according to the STS clinical guidelines [12].
Statistical Analysis.
Continuous variables were assessed for normality and presented as means (standard deviation) or medians (interquartile range). Groups were compared by two-sample t-tests or the Wilcoxon Rank Sum Test for continuous variables and the chi-square test of independence for categorical variables. A propensity-adjusted matching was used via a multiple logistic regression with CKD as the dependent variable and all demographics and pre-operative variables added to the model.
A 1:1 greedy nearest neighbor with no replacement match and caliper width of 0.2 produced two groups (CKD and non-CKD), with the first group including 3,419 patients and the second group including 1,452 patients. The matching success was assessed by computing each covariate's percent bias (similar to standardized mean difference) with a cut-off of 2% to denote acceptable balance. Matched samples were compared with McNemar's test and marginal homogeneity tests for categorical variables and checked paired t-tests and signed rank tests for continuous variables. Adjusted survival functions for these interactions were plotted using Stata's st curve command. All analyses were performed in Stata 17.0 (Statacorp, LLC. College Station, TX). 95% confidence intervals and p-values are reported, with a p-value < 0.05 considered significant.
Propensity-adjustment Significance Compared to Propensity-score Matching.
Propensity-matching provides excellent matching before the analysis, while the propensity-adjustment accounts for biases during the analysis. Therefore, while seeing significant differences between pre-operative variables, these differences are adjusted during the modeling process. Propensity-matching reduces the size of the groups, while propensity adjustment retains the sample size of the groups. As shown by multiple studies, propensity adjustments provide similar or better adjustment for biases compared to propensity-matching because of the retainment of the sample size, which increases the statistical power of the analysis and is particularly suitable for smaller sample sizes [13].
2.7. Covariates and Exposures.
Covariate included age, gender, race, STS-PROM risk of mortality, body mass index (BMI), obesity, creatinine level, comorbidities such as pre-operative dialysis, smoking, chronic obstructive pulmonary disease (COPD), hypertension, dyslipidemia, cerebrovascular disorder (CBVD), peripheral vascular infection (PVD), liver disease, diabetes, mediastinal radiation, prior percutaneous coronary intervention (PCI), prior CABG, prior myocardial infarction (MI), last valve surgery, atrial fibrillation (Afib), ejection fraction (EF), number of diseased vessels, left central coronary artery stenosis, severe proximal LAD lesion, LITA and radial artery graft use.
Results
Pre-operative Characteristics.
There were 4,871 patients, of whom 3,419 did not have CKD and 1,452 had CKD (Table 1). Mean age was 67.65 (±10.14) vs 78.87 (±8.95) in non-CKD and CKD patients, respectively.
Table 1: Pre-operative Characteristics.
|
No CKD n = 3,419 |
CKD n = 1,452 |
p- value |
|
|
Age Years (mean/SD) |
67.65 (10.14) |
78.87 (8.95) |
<.001 |
|
Gender |
<.001 |
||
|
Female n (%) |
670 (19.6%) |
507 (34.9%) |
|
|
Male n (%) |
2749 (80.4%) |
945 (65.1%) |
|
|
Race n (%) |
0.062 |
||
|
White n (%) |
3045 (89.1%) |
1260 (86.8%) |
|
|
Black or African American n (%) |
302 (8.8%) |
159 (10.1%) |
|
|
Other n (%) |
72 (2.1%) |
33 (2.3%) |
|
|
STS-PROM Risk of Mortality (median/IQR) |
0.69 (.43-1.3) |
2.69 (1.5-5.3) |
<.0001 |
|
BMI kg/m2(Mean/SD) |
30.49 (9.4) |
26.49 (4.6) |
<.0001 |
|
Obese (>25 kg/m2) n (%) |
1576 (46.1%) |
282 (19.4%) |
<.0001 |
|
Creatine Level (Median/IQR) |
0.9 (.8-1.1) |
1.3 (1.1-1.6) |
<.0001 |
|
Dialysis n (%) |
8 (0.2%) |
111 (7.6%) |
<.001 |
|
Smoking n (%) |
1629 (47.65%) |
638 (43.94%) |
0.018 |
|
COPD n (%) |
487 (14.2%) |
280 (19.3%) |
<.001 |
|
Arterial Hypertension n (%) |
2892 (84.6%) |
1313 (90.4%) |
<.001 |
|
Dyslipidemia n (%) |
2970 (86.87%) |
1261 (86.85%) |
0.984 |
|
Cerebrovascular Disease n (%) |
465 (13.6%) |
433 (29.8%) |
<.001 |
|
PVD n (%) |
365 (10.7%) |
357 (24.6%) |
<.001 |
|
Liver disease n (%) |
43 (1.26 %) |
19 (1.31%) |
0.885 |
|
Diabetes n (%) |
1393 (40.7%) |
626 (43.1%) |
0.125 |
|
Mediastinal Radiation n (%) |
29 (0.85%) |
16 (1.1%) |
0.397 |
|
Previous PCI n (%) |
1288 (37.7%) |
530 (36.5%) |
0.440 |
|
Prior CABG n (%) |
65 (1.9%) |
47 (3.2%) |
0.004 |
|
Prior MI n (%) |
1829 (53.5%) |
895 (61.6%) |
<.001 |
|
Prior Valve Surgery n (%) |
10 (0.29%) |
20 (1.38%) |
<.001 |
|
Atrial Fibrillation n (%) |
364 (10.7%) |
229 (15.7%) |
<.001 |
|
Pre-operative EF% (mean/SD) |
53.4% (12.5%) |
50.20% (14.9%) |
<.001 |
|
EF < 50% n (%) |
888% (26.0%) |
524% (36.1%) |
<.001 |
|
Diseased Vessels |
<.001 |
||
|
1 n (%) |
366 (10.7%) |
93 (6.4%) |
|
|
2 n (%) |
873 (25.5%) |
352 (24.2%) |
|
|
3 n (%) |
2048 (59.9%) |
958 (65.98%) |
|
|
4 n (%) |
132 (3.86%) |
49 (3.37%) |
|
|
Left Main Stenosis > 50% n (%) |
814 (23.81%) |
417 (28.72%) |
<.001 |
|
Severe Proximal LAD Lesion > 70% n (%) |
2898 (84.8%) |
1189 (81.9%) |
0.013 |
CKD – chronic kidney disease, COPD – chronic obstructive pulmonary disease, BMI – body mass index, PVD – peripheral vascular disease, PCI – percutaneous coronary intervention, CABG – coronary artery bypass grafting, MI – myocardial infarction, EF – ejection fraction, LAD – left anterior descending, IMA – internal mammary artery
Intra-operative Outcomes.
Procedural characteristics included number of grafts (p=0.002), multiarterial CABG (p<0.001), total arterial CABG (p<0.001), and surgery priority (p<0.001) (Table 2).
Table 2: Procedural Characteristics.
|
Procedural Characteristics |
No CKD n = 3,419 |
CKD n = 1,452 |
P - value |
|
SVG, n (%) |
1713 (50.1%) |
734 (50.55%) |
0.775 |
|
IMA n (%) |
|
|
<.001 |
|
Single n (%) |
2911 (85.1%) |
1322 (91.1%) |
|
|
Both n (%) |
445 (13%) |
102 (7%) |
|
|
None n (%) |
63 (1.8%) |
28 (1.9%) |
|
|
Radial Artery Graft use n (%) |
761 (22.3%) |
132 (9.1%) |
<.001 |
|
Number of Grafts (Median/IQR) |
2 (1-3) |
2 (1-3) |
0.002 |
|
Number of Grafts |
<.001 |
||
|
1 n (%) |
1409 (41.2%) |
629 (43.3%) |
|
|
2 n (%) |
530 (15.5%) |
298 (20.5%) |
|
|
3 n (%) |
880 (25.7%) |
308 (21.2%) |
|
|
4 n (%) |
453 (13.3%) |
162 (11.2%) |
|
|
5+ n (%) |
14 (4.3%) |
55 (3.8%) |
|
|
Total Arterial CABG n (%) |
975 (28.5%) |
203 (14.0%) |
<.001 |
|
Multiarterial CABG n (%) |
947 (27.7%) |
330 (22.7%) |
<.001 |
|
On-Pump |
502 (14.7%) |
189 (13%) |
0.127 |
|
Surgery Priority |
<.001 |
||
|
Elective n (%) |
1942 (56.8%) |
669 (46.1%) |
|
|
Urgent n (%) |
1447 (42.3 %) |
770 (53.0%) |
|
|
Emergent n (%) |
30 (0.88%) |
13 (0.90%) |
|
|
Time in OR (Hours) Mean/SD |
6.0 (1.3) |
5.9 (1.3) |
0.0002 |
|
All type of Blood Products Transfusion n (%) |
466 (13.6%) |
432 (29.7%) |
<.001 |
|
RBC Units n (%) |
362 (10.6%) |
410 (28.2%) |
<.001 |
|
Cryoprecipitate Units n (%) |
117 (3.4%) |
70 (4.8%) |
0.02 |
|
Platelet Units n (%) |
197 (5.7%) |
144 (9.9%) |
<.001 |
|
FFP Units n (%) |
68 (2%) |
39 (2.7 %) |
0.129 |
|
Extubated in OR n (%) |
2707 (79.2%) |
1048 (72.2%) |
<.001 |
CKD-chronic kidney disease, SVG – saphenous venous grafting, CABG – coronary artery bypass grafting, IMA- internal mammary artery, RBC- red blood cells, FFP-fresh frozen plasma, OR-operative room.
Post-operative Outcomes.
CKD patients had higher rates of blood transfusions and blood products, a lower percentage of patients extubated in the OR (72.2% vs. 79.2%, p<.001), and hours in the operating room OR (5.9 hours vs. 6.0 hours, p<.001), longer intensive care unit (ICU) stays and total length of stay (LOS), higher rates of blood transfusions and blood products, prolonged ventilation (7.4% vs. 2.8%, p<.001), renal failure (4.1% vs. 1.0%, p<.001), dialysis (1.4% vs. 0.15%, p<.001), Afib (27.2% vs 20.5%, p<.001), 30-day readmissions (11.0% vs 6.7%, p<.001), and 30-day all-cause mortality (2.4% vs 0.4%, p<.001) compared to non-CKD patients (Table 3).
Table 3: Intra-operative and Post-operative Outcomes Propensity-Adjusted.
|
Intra-operative Outcomes |
No CKD n = 3,419 |
CKD n =1,452 |
p-value |
Propensity Score Adjusted |
p-value |
|
Adj. Mean Difference (95% CI) |
|||||
|
|
|
|
|
Adj. Odds Ratio (95% CI) |
p-value |
|
Time in OR (Hours) Mean/SD |
6.0 (1.3) |
5.9 (1.3) |
0.0002 |
0.16 (0.24, 0.08) |
<.001 |
|
All type of Blood Products Transfusion n (%) |
466 (13.6%) |
432 (29.7%) |
<.001 |
2.69 (2.31-3.12) |
<.001 |
|
RBC Units n (%) |
362 (10.6%) |
410 (28.2%) |
<.001 |
3.35 (2.85-3.93) |
<.001 |
|
Cryoprecipitate Units n (%) |
117 (3.4%) |
70 (4.8%) |
0.02 |
1.41 (1.04-1.91) |
0.025 |
|
Platelet Units n (%) |
197 (5.7%) |
144 (9.9%) |
<.001 |
1.78 (1.42, 2.23) |
<.001 |
|
FFP Units n (%) |
68 (2%) |
39 (2.7 %) |
0.129 |
1.33 (0.89-1.99) |
0.158 |
|
Extubated in OR n (%) |
2707 (79.2%) |
1048 (72.2%) |
<.001 |
0.69 (0.59-0.79) |
<.001 |
|
Post-operative Outcomes |
Adj. Mean Difference (95% CI) |
p-value |
|||
|
Total ICU (Hours) (Median/IQR) |
42 (24.6-71.2) |
50 (26.1-96.8) |
<.001 |
37.55 (29.65, 45.46) |
<.001 |
|
Total LOS (Days) (Median/IQR) |
5 (4-6) |
6 (4-8) |
<.001 |
2.50 (2.12, 2.88) |
<.001 |
|
Adj. Odds Ratio (95% CI) |
p-value |
||||
|
All type of Blood Transfusion n (%) |
861 (25.2%) |
679 (46.7%) |
<.001 |
2.61 (2.29-2.97) |
<.001 |
|
RBC Units n (%) |
835 (24.4%) |
664 (45.7%) |
<.001 |
2.61 (2.29-2.97) |
<.001 |
|
Cryoprecipitate Units n (%) |
118 (3.5%) |
82 (5.7%) |
<.001 |
1.70 (1.27-2.27) |
<.001 |
|
Platelet Units n (%) |
154 (4.5%) |
122 (8.4%) |
<.001 |
1.97 (1.54-2.51) |
<.001 |
|
FFP Units n (%) |
86 (2.5%) |
90 (6.2%) |
<.001 |
2.56 (1.89-3.46) |
<.001 |
|
Stroke n (%) |
16 (0.47%) |
12 (0.83%) |
0.13 |
1.27 (0.83-1.94) |
0.264 |
|
Superficial Infection n (%) |
15 (0.4%) |
2 (0.1%) |
0.103 |
0.30 (0.070-1.34) |
0.115 |
|
Deep Sternal Infection n (%) |
11 (0.32%) |
5 (0.34%) |
0.9 |
0.91 (0.31-2.66) |
0.864 |
|
Reoperation for Bleeding n (%) |
33 (0.97%) |
14 (0.96%) |
0.997 |
1.01 (0.54-1.89) |
0.977 |
|
Unplanned PCI n (%) |
7 (0.2%) |
7 (0.5%) |
0.098 |
2.33 (0.82-6.67) |
0.114 |
|
Prolonged Ventilation |
96 (2.8%) |
107 (7.4%) |
<.001 |
2.72 (2.04-3.61) |
<.001 |
|
Acute Renal Failure n (%) |
33 (1.0%) |
59 (4.1%) |
<.001 |
4.26 (2.77-6.57) |
<.001 |
|
New Dialysis n (%) |
5 (0.15 %) |
20 (1.4%) |
<.001 |
9.29 (3.47-24.81) |
<.001 |
|
Post-operative Atrial Fibrillation n (%) |
701 (20.5%) |
395 (27.2%) |
<.001 |
1.44 (1.25-1.67) |
<.001 |
|
30 Day Readmission n (%) |
231 (6.7%) |
160 (11%) |
<.001 |
1.70 (1.37-2.10) |
<.001 |
|
30-day all cause Death n (%) |
15 (0.4%) |
35 (2.4%) |
<.001 |
5.50 (2.99-10.10) |
<.001 |
CKD- chronic kidney disease, RBC – red blood cell, FFP – fresh frozen plasma, PCI – percutaneous coronary
Follow-up Outcomes.
The median follow-up time for survival was 4.0 years (1.2-7.7) for CKD patients and 3.8 years (1.1-7.7) for non-CKD patients (p=0.368) (Table 4-6). CKD patients had a significantly higher rate of mortality (20.4% vs 7.8%, p<.001) compared to non-CKD patients. Our univariable Cox proportional analysis (Model 1) (Table 5) showed that patients with CKD had a significantly higher risk of mortality (HR 2.5 [2.1, 3.0]). CKD patients had a substantially higher rate of mortality at one year (1.2% vs 4.4%, p<.001), two years (1.8% vs. 6.6%, p<.001), five years (3.5% vs. 12.0%, p<.001), and ten years (6.3% vs. 18.4%, p<.001) compared to non-CKD patients. The risk of mortality (Table 6) was also higher for CKD patients at one year (HR 3.5 [2.4, 5.2]), two years (HR 3.5 [2.6, 4.9]), five years (HR 3.3 [2.6, 4.2]), and ten years (HR 2.8 [2.4,3.4]). All other outcomes were not significantly different between the groups. The Kaplan Meier Survival Curves (Figure 1) and the cumulative hazard function graphs (Figure 2) showed a higher survival rate in non-CKD patients, while all other outcomes were not different. For our multivariable and doubly robust models, all-cause mortality was further examined with interactions between the CKD groups and significant risk factors for mortality discovered in the univariable analysis.
Risk predictors specific for all-cause death in patients with CKD were Afib (HR 1.6 [1.3, 2.0]), male sex (HR 1.8 [1.4, 2.3]), white patients (HR 1.6 [1.3, 2.0]), dialysis (HR 2.7 [1.9, 4.0]), hypertension (HR 1.7 [1.1, 2.6]).
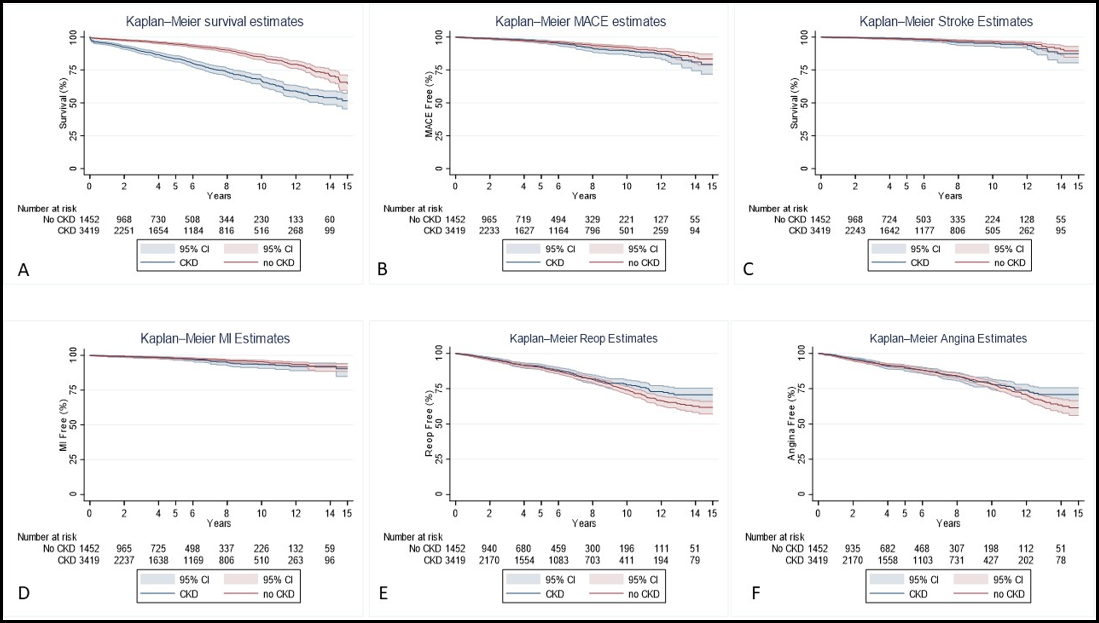
Figure 1: Kaplan-Meier Survival Curves
Legend: A-Survival rate; B-MACE; C-Stroke; D-MI; E-Angina; F; Repeat Intervention
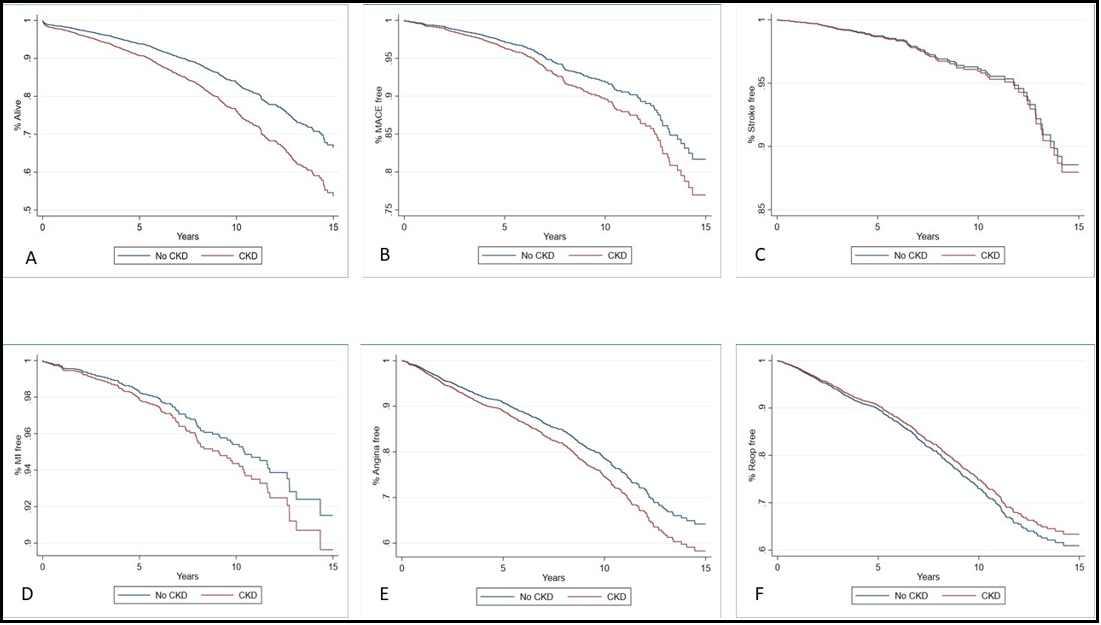
Figure 2: Long-Term Outcomes Cumulative Hazard Function Graphs in Multivariable Analysis
Legend: A-Survival rate; B-MACE; C-Stroke; D-MI; E-Angina; F; Repeat Intervention
Table 4: Long-Term Outcomes.
|
|
No CKD n = 3.419 |
CKD n =1.452 |
P - value |
|
Mortality (all cause) |
|
|
|
|
Yes n (%) |
3153 (92.2%) |
1155 (79.5%) |
<0.001 |
|
No n (%) |
266 (7.8%) |
297 (20.4%) |
|
|
|
|
|
|
|
MACCE n (%) |
136 (4.0%) |
71 (4.9%) |
0.149 |
|
Stroke n (%) |
63 (1.8%) |
34 (2.3%) |
0.254 |
|
MI n (%) |
79 (2.3%) |
40 (2.7%) |
0.358 |
|
Reoperation n (%) |
412 (12.0%) |
156 (10.7%) |
0.194 |
|
Angina n (%) |
380 (11.1%) |
154 (10.6%) |
0.603 |
|
Follow-up Time |
|
|
|
|
Survival (all cause) |
3.8 (1.1-7.7) |
4.0 (1.2-7.7) |
0.368 |
|
MACCE |
3.7 (1.1-7.7) |
3.9 (1.1-7.5) |
0.368 |
|
Stroke |
3.8 (1.1-7.7) |
3.9 (1.2-7.5) |
0.380 |
|
MI |
3.8 (1.1-7.7) |
3.9 (1.2-7.5) |
0.345 |
|
Reoperation |
3.5 (1.0-7.0) |
3.6 (1.1-7.0) |
0.332 |
|
Angina |
3.5 (1.0-7.3) |
3.6 (1.1-7.2) |
0.373 |
CKD-chronic kidney disease, MI – myocardial infarction
Table 5: Long-Term Outcomes at 1, 2, 5 and 10 Years.
|
Long-Term Outcomes |
No CKD n = 3.149 |
CKD n = 1.452 |
p-value |
|
All-Cause Mortality |
|
|
|
|
1-year n (%) |
42 (1.2%) |
64 (4.4%) |
<.0001 |
|
2-years n (%) |
63 (1.8%) |
96 (6.6%) |
<.0001 |
|
5-years n (%) |
121 (3.5%) |
174 (12.0%) |
<.0001 |
|
10-years n (%) |
212 (6.3%) |
260 (18.4%) |
<.0001 |
|
MACCE |
|||
|
1-year n (%) |
19 (0.6%) |
6 (0.4%) |
0.524 |
|
2-years n (%) |
30 (0.9%) |
10 (0.7%) |
0.504 |
|
5-years n (%) |
72 (2.1%) |
29 (2.0%) |
0.808 |
|
10-years n (%) |
115 (3.4%) |
59 (4.1%) |
0.229 |
|
Stroke |
|||
|
1-year n (%) |
5 (0.1%) |
3 (0.2%) |
0.634 |
|
2-years n (%) |
10 (0.3%) |
3 (0.2%) |
0.595 |
|
5-years n (%) |
30 (0.9%) |
11 (0.8%) |
0.675 |
|
10-years n (%) |
50 (1.5%) |
25 (1.7%) |
0.501 |
|
Myocardial Infarction |
|||
|
1-year n (%) |
15 (0.4%) |
3 (0.2%) |
0.222 |
|
2-years n (%) |
21 (0.6%) |
7 (0.5%) |
0.577 |
|
5-years n (%) |
45 (1.3%) |
19 (1.3%) |
0.983 |
|
10-years n (%) |
68 (2.0%) |
37 (2.6%) |
0.219 |
|
Reoperation |
|||
|
1-year n (%) |
49 (1.4%) |
18 (1.2%) |
0.596 |
|
2-years n (%) |
108 (3.2%) |
41 (2.8%) |
0.534 |
|
5-years n (%) |
220 (6.4%) |
90 (6.2%) |
0.757 |
|
10-years n (%) |
370 (10.8%) |
144 (9.9%) |
0.347 |
|
Angina |
|||
|
1-year n (%) |
56 (1.8%) |
18 (1.4%) |
0.296 |
|
2-years n (%) |
119 (3.5%) |
45 (3.1%) |
0.500 |
|
5-years n (%) |
213 (6.2%) |
96 (6.6%) |
0.617 |
|
10-years n (%) |
330 (9.6%) |
141 (9.7%) |
0.949 |
Table 6: Observed Cumulative Incidence of Long-Term Outcomes.
|
Long-Term Outcomes |
Unweighted HR (95% CI) |
p-value |
Weighted HR (95% CI) |
p-value |
|
All-Cause Mortality |
|
|
|
|
|
1-year |
3.5 (2.4, 5.2) |
<.0001 |
1.8 (1.1, 3.0) |
0.026 |
|
2-years |
3.5 (2.6, 4.9) |
<.0001 |
1.9 (1.2, 2.9) |
0.004 |
|
5-years |
3.3 (2.6, 4.2) |
<.0001 |
2.0 (1.5, 2.7) |
<.0001 |
|
10-years |
2.8 (2.4, 3.4) |
<.0001 |
1.8 (1.4, 2.3) |
<.0001 |
|
MACCE |
|
|
|
|
|
1-year |
0.7 (0.3, 1.8) |
0.519 |
0.3 (0.09, 1.0) |
0.052 |
|
2-years |
0.8 (0.4, 1.6) |
0.494 |
0.5 (0.2, 1.2) |
0.138 |
|
5-years |
0.9 (0.6, 1.4) |
0.746 |
0.7 (0.4, 1.2) |
0.153 |
|
10-years |
1.2 (0.9, 1.6) |
0.264 |
1.2 (0.8, 1.8) |
0.343 |
|
Stroke |
|
|
|
|
|
1-years |
1.4 (0.3, 5.9) |
0.640 |
1.2 (0.3, 5.1) |
0.831 |
|
2-years |
0.7 (0.2, 2.5) |
0.590 |
0.5 (0.1, 1.9) |
0.322 |
|
5-years |
0.8 (0.4, 1.7) |
0.640 |
0.6 (0.3, 1.2) |
0.178 |
|
10-years |
1.2 (0.7, 1.9) |
0.537 |
0.9 (0.5, 1.5) |
0.716 |
|
Myocardial Infarction |
|
|
|
|
|
1-year |
0.5 (0.1, 1.6) |
0.230 |
0.5 (0.1, 2.2) |
0.355 |
|
2-years |
0.8 (0.3, 1.8) |
0.568 |
0.9 (0.3, 2.6) |
0.841 |
|
5-years |
0.98 (0.6, 1.7) |
0.933 |
0.9 (0.5, 1.8) |
0.738 |
|
10-years |
1.3 (0.8, 1.9) |
0.248 |
1.4 (0.8, 2.2) |
0.226 |
|
Reoperation |
|
|
|
|
|
1-years |
0.9 (0.5, 1.5) |
0.588 |
1.3 (0.7, 2.4) |
0.422 |
|
2-years |
0.9 (0.6, 1.3) |
0.501 |
1.02 (0.7, 1.6) |
0.921 |
|
5-years |
0.9 (0.7, 1.2) |
0.673 |
0.9 (0.7, 1.3) |
0.68 |
|
10-years |
0.9 (0.7, 1.1) |
0.29 |
0.9 (0.7, 1.2) |
0.577 |
|
Angina |
|
|
|
|
|
1-year |
0.7 (0.4, 1.3) |
0.296 |
1.04 (0.5, 2.0) |
0.908 |
|
2-years |
0.9 (0.6, 1.2) |
0.474 |
1.1 (0.8, 1.7) |
0.509 |
|
5-years |
1.05 (0.8, 1.3) |
0.711 |
1.4 (1.03, 1.8) |
0.033 |
|
10-years |
0.99 (0.8, 1.2) |
0.946 |
1.3 (1.01, 1.6) |
0.041 |
Table 7: Comparison of risk predictors for all-cause death in patients with and without CKD.
|
Risk Predictors |
CKD HR (95% CI) |
Non-CKD HR (95% CI) |
|
Female Gender |
1.3 (1.0, 1.8) |
1.1 (0.8, 1.4) |
|
Male Gender |
1.7 (1.3, 2.1) |
NA |
|
Black Race |
0.9 (0.6, 1.4) |
1.1 (0.8, 1.6) |
|
White Race |
1.7 (1.3, 2.1) |
NA |
|
Other race |
0.4 (0.1, 1.3) |
0.9 (0.3, 2.5) |
|
Diabetes |
2.2 (1.6, 2.9) |
1.5 (1.2, 1.9) |
|
STS-PROM Risk Score ≥ 4% |
2.6 (1.9, 3.5) |
1.8 (1.2, 2.8) |
|
Dialysis |
5.2 (3.7, 7.5) |
2.3 (0.3, 16.6) |
|
Hypertension |
1.7 (1.1, 2.6) |
1.1 (0.8, 1.7) |
|
COPD |
2.0 (1.4, 2.7) |
1.7 (1.3, 2.2) |
|
PVD |
2.0 (1.5, 2.6) |
1.5 (1.1, 2.0) |
|
EF < 50% |
2.4 (1.8, 3.2) |
1.8 (1.4, 2.3) |
|
Atrial Fibrillation |
1.7 (1.2, 2.4) |
1.2 (0.9, 1.7) |
COPD-chronic obstructive pulmonary disease; PVD-peripheral vascular disease; EF-ejection fraction.
Discussion
Summary of findings:
1. All causes of death in patients with CKD are higher than in patients without CKD.
2. Postoperatively, patients with CKD had a longer time of ICU stay, hospital LOS, and a higher rate of blood product utilization as compared to patients without CKD.
3. Herein, we provide risk predictors for all-cause mortality in patients with CKD undergoing isolated CABG.
Comments
This analysis provided several novel insights into the fragile CKD population undergoing isolated CABG. Firstly, all-cause mortality in patients with CKD was higher than in patients without CKD. Secondly, new risk predictors for long-term prognosis in patients with CKD were found.
This study demonstrated that patients with CKD undergoing isolated CABG had an increased risk of mortality compared to patients without CKD. Similarly, the ISCHEMIA-CKD clinical trial showed a comparable risk of mortality in patients undergoing revascularization either with PCI or surgery (HR 95% CI 1.00 (0.72-1.39) [16-17]. In this context, a report by the National Kidney Foundation has shown a high prevalence of cardiovascular disease in patients with CKD and a 10–30-fold higher mortality rate in patients with end-stage renal disease compared to the general population [18]. In addition, the Japan Adult Cardiovascular Surgery Database study reported that patients under dialysis undergoing revascularization had a higher incidence of operative mortality, 30-day mortality, and significant complications [19]. In this context, these patients should be closely monitored postoperatively, while pre-operative work-up should be meticulous, including carotid ultrasound laboratory results with T3 levels, calcium/albumin levels, and pro-BNP. We believe this may help to reduce the chances of complications after surgery.
The increasing global prevalence of diabetes and CKD has led to the growing epidemic of diabetic nephropathy [20]. In this context, cardiovascular mortality and progression to end-stage renal disease are two primary unmet medical needs in patients with CKD plus diabetes. Although medical therapy, including SGLT-2 inhibitors and strict glycemic control through insulin injection, has changed the negative survival trend in these patients, the damaging burden of diabetes remains. Our results confirm the risky combination of diabetes and CKD in CAD patients undergoing CABG.
Our study found that patients with CKD and low EF have a high hazard ratio for all causes of death. Similarly, a recent analysis found that CKD in patients undergoing CABG conferred a higher risk of postoperative acute kidney injury, perioperative MI, gastrointestinal bleeding, secondary tracheal intubation, stroke, chest wound infection, prolonged mechanical ventilation (≥ 24 h), extended ICU stay (≥ 72 h), prolonged LOS (≥ 14 days), dialysis requirement, and post-operative death within 30 days [21]. In addition, a sub-analysis of the Surgical Treatment for Ischemic Heart Failure (STICH) clinical trial showed an inverse association between estimated glomerular filtration rate (GFR) and risk of death, cardiovascular death, or cardiovascular rehospitalization (all P < .001, but not for stroke, P = .697) [22]. Therefore, CKD confers a higher risk of complications and death.
Bilateral artery use of the mammary artery (BIMA) positively affects CKD [23]. However, clinical studies have not proven the benefits of BIMA in CKD patients, and our study did not show BIMA as a protective factor in patients with CKD. However, the small number of BIMA in our population could have influenced these outcomes.
White race, PVD, male sex, COPD, and a high STS score have been proven to harm patients with diabetes. In our study, the increased risk for early and late mortality among patients with these risk factors was comparable to those previously reported [24-25].
Observational data suggested that, in dialysis patients, CABG may provide a survival benefit [26-28]. In fact, in concordance with the results of our study, the Alberta Provincial Project for Outcome Assessment in Coronary Heart Disease (APPROACH) [29] determined that CKD confers a higher mortality risk in patients with coronary artery disease.
Similarly to other studies, our analysis found that dialysis, diabetes, EF<50%, white race, PVD, male sex, and COPD confer a high hazard ratio. Our study found that other risk factors, including a high STS score and pre-operative Afib when associated with CKD, increase the risk of mortality in patients undergoing revascularization. Therefore, a pre-operative heart rhythm optimization can improve clinical outcomes in these patients.
Limitations
This retrospective study was subject to all limitations inherent to a non-randomized study, including potential selection bias regarding which patients underwent CABG in CKD versus non-CKD. However, the rigorous propensity-adjusted score analysis limited these biases. In addition, the study includes a considerable timeframe (2005-2021), and critical technical advances and changes in surgical and medical therapy have occurred in this period. The lack of differentiation in former versus active smokers can limit the study. The lack of a patient's family history for a specific disease, vital parameters at the time of surgery, and broader echocardiographic outcomes is a further limitation.
Conclusions
Patients with CKD undergoing isolated CABG had a significantly higher incidence of all cause death compared to those without CKD. Herein, we found risk predictors for long-term all-cause mortality in the CKD cohort undergoing isolated CABG.
Conflict of Interest: The authors declare no conflict of interest.
Data Availability Statement: The deidentified data are available upon reasonable request to dr. Serge Sicouri, pending institutional approval.
Disclosures: Authors have reported that they have no relationships relevant to the contents of this study to disclose.
References
- Cai Q, Mukku VK, Ahmad M (2013) Coronary artery disease in patients with chronic kidney disease: a clinical update. Curr Cardiol Rev. 9(4): 331–339.
- Levine GN, Bates ER, Blankenship JC, Bailey SR, Bittl JA, et al. (2011) 2011 ACCF/AHA/SCAI guideline for percutaneous coronary intervention. A report of the American College of Cardiology Foundation/American Heart Association Task Force on Practice Guidelines and the Society for Cardiovascular Angiography and Interventions. J Am Coll Cardiol. 58(24): 2550–2583.
- Bangalore S, Maron DJ, Fleg JL, O’Brien SM, Herzog CA, et al. (2018) International Study of Comparative Health Effectiveness with Medical and Invasive Approaches-Chronic Kidney Disease (ISCHEMIA-CKD): rationale and design. Am Heart J. 205: 42– 52.
- Matsushita K, van der Velde M, Astor BC, Woodward M, Levey AS, et al. (2010) Association of estimated glomerular filtration rate and albuminuria with all-cause and cardiovascular mortality in general population cohorts: a collaborative meta-analysis. Lancet. 375(9731): 2073-81.
- De Bruyne B, Pijls NH, Kalesan B, Barbato E, Tonino PA, et al. (2012) Fractional flow reserve-guided PCI versus medical therapy in stable coronary disease. N Engl J Med. 367(11): 991-1001.
- Frye RL, August P, Brooks MM, Hardison RM, Kelsey SF, et al. (2009) A randomized trial of therapies for type 2 diabetes and coronary artery disease. N Engl J Med. 360(24): 2503-15.
- Boden WE, O'Rourke RA, Teo KK, Hartigan PM, Maron DJ, et al. (2007) Optimal medical therapy with or without PCI for stable coronary disease. N Engl J Med. 356(15): 1503-16.
- Stone GW, Kappetein AP, Sabik JF, Pocock SJ, Morice MC, et al. (2019) Five-Year Outcomes after PCI or CABG for Left Main Coronary Disease. N Engl J Med. 381(19): 1820-1830.
- Bangalore S, Maron DJ, O'Brien SM, Fleg JL, Kretov EI, et al. (2020) Management of Coronary Disease in Patients with Advanced Kidney Disease. N Engl J Med. 382(17): 1608-1618.
- Stone NJ, Robinson JG, Lichtenstein AH, Bairey Merz CN, Blum CB, et al. (2014) 2013 ACC/AHA guideline on the treatment of blood cholesterol to reduce atherosclerotic cardiovascular risk in adults: a report of the American College of Cardiology/American Heart Association Task Force on Practice Guidelines. J Am Coll Cardiol. 63(25 Pt B): 2889-934.
- Stone NJ, Robinson JG, Lichtenstein AH, Bairey Merz CN, Blum CB, et al. (2014) 2013 ACC/AHA guideline on the treatment of blood cholesterol to reduce atherosclerotic cardiovascular risk in adults: a report of the American College of Cardiology/American Heart Association Task Force on Practice Guidelines. Circulation. 129(25 Suppl 2): S1-45.
- Rinehart AL, Herzog CA, Collins AJ, Flack JM, Ma JZ, et al. (1995) A comparison of coronary angioplasty and coronary artery bypass grafting outcomes in chronic dialysis patients. Am J Kidney Dis. 25(2): 281–290.
- Elze MC, Gregson J, Baber U, Williamson E, Sartori S, et al. (2017) Comparison of Propensity Score Methods and Covariate Adjustment: Evaluation in 4 Cardiovascular Studies. J Am Coll Cardiol. 69(3): 345-357.
- Collins P, Webb CM, Chong CF, Moat NE (2008) Radial Artery Versus Saphenous Vein Patency (RSVP) Trial Investigators. Radial artery versus saphenous vein patency randomized trial: five-year angiographic follow-up. Circulation. 117(22): 2859-64.
- Gaudino M, Benedetto U, Fremes S, Biondi-Zoccai G, Sedrakyan A, et al. (2018) Radial-Artery or Saphenous-Vein Grafts in Coronary-Artery Bypass Surgery. N Engl J Med. 378(22): 2069- 2077.
- Buxton BF, Raman JS, Ruengsakulrach P, Gordon I, Rosalion A, et al. (2003) Radial artery patency and clinical outcomes: five- year interim results of a randomized trial. J Thorac Cardiovasc Surg. 125(6): 1363-1371.
- Harskamp RE, Alexander JH, Schulte PJ, Brophy CM, Mack MJ, et al. (2014) Vein graft preservation solutions, patency, and outcomes after coronary artery bypass graft surgery: follow-up from the PREVENT IV randomized clinical trial. JAMA Surg. 149(8): 798-805.
- Bangalore S, Maron DJ, O'Brien SM, Fleg JL, Kretov EI, et al. (2020) Management of Coronary Disease in Patients with Advanced Kidney Disease. N Engl J Med. 382(17): 1608-1618.
- Hori D, Yamaguchi A, Adachi H (2017) Coronary Artery Bypass Surgery in End-Stage Renal Disease Patients. Ann Vasc Dis. 10(2): 79-87.
- Sarnak MJ, Levey AS, Schoolwerth AC, Coresh J, Culleton B, et al. (2003) Kidney disease as a risk factor for development of cardiovascular disease: a statement from the American Heart Association Councils on Kidney in Cardiovascular Disease, High Blood Pressure Research, Clinical Cardiology, and Epidemiology and Prevention. Circulation. 108(17): 2154-2169.
- Yamauchi T, Miyata H, Sakaguchi T, Miyagawa S, Yoshikawa Y, et al. (2012) Coronary artery bypass grafting in hemodialysis- dependent patients: analysis of Japan Adult Cardiovascular Surgery Database. Circ J. 76(5): 1115-20.
- Li X, Zhang S, Xiao F (2020) Influence of chronic kidney disease on early clinical outcomes after off-pump coronary artery bypass grafting. J Cardiothorac Surg. 15(1): 199.
- Doenst T, Haddad H, Stebbins A, Hill JA, Velazquez EJ, et al. (2022) Renal function and coronary bypass surgery in patients with ischemic heart failure. J Thorac Cardiovasc Surg. 163(2): 663-672.e3.
- Yi G, Shine B, Rehman SM, Altman DG, Taggart DP (2014) Effect of bilateral internal mammary artery grafts on long-term survival: a meta-analysis approach. Circulation. 130(7): 539-45.
- Moroni F, Beneduce A, Giustino G, Briede I, Park SJ, et al. (2022) Sex Differences in Outcomes After Percutaneous Coronary Intervention or Coronary Artery Bypass Graft for Left Main Disease: From the DELTA Registries. J Am Heart Assoc. 11(5): e022320.
- Baber U, Howard VJ, Halperin JL, Soliman EZ, Zhang X, et al. (2011) Association of chronic kidney disease with atrial fibrillation among adults in the United States: REasons for Geographic and Racial Differences in Stroke (REGARDS) Study. Circ Arrhythm Electrophysiol. 4(1): 26-32.
- Szczech LA, Reddan DN, Owen WF, Califf R, Racz M, et al. (2001) Differential survival after coronary revascularization procedures among patients with renal insufficiency. Kidney Int. 60(1): 292–299.
- Herzog CA, Ma JZ, Collins AJ (2002) Comparative survival of dialysis patients in the United States after coronary angioplasty, coronary artery stenting, and coronary artery bypass surgery and impact of diabetes. Circulation. 106(17): 2207–2211.
- Hemmelgarn BR, Southern D, Culleton BF, Mitchell LB, Knudtson ML, et al. (2004) Survival after coronary revascularization among patients with kidney disease. Circulation. 110(14): 1890-5.