


Mohadeb Praveen Shivchandra1, Mohadeb-Somar Jhassu Varsha Naveena2, Somar Mirinal3*
1MBBS, Private practice, Mauritius
2BDS, MDS, PhD, Dental specialist (Orthodontist), Ministry of Health and Wellness, Mauritius
3BDS, MDS, PhD, Assistant Professor, JSS academy Mauritius, Orthodontist, Private Practice, Mauritius
*Corresponding Author: Somar Mirinal, BDS, MDS, PhD, Assistant Professor, JSS academy Mauritius, Orthodontist, Private Practice, Mauritius.
Abstract
Aims and objectives: This study assessed the degree of patient satisfaction among the clinical and non-clinical dental services offered at dental centers in private dental healthcare in Mauritius. Factors associated with the degree of overall satisfaction were investigated.
Materials and Methods: A random sample of 271 patients who visited seven private dental healthcare facilities in Mauritius was recruited. A self-administered Likert-type scale questionnaire was used to determine the level of satisfaction with dental services offered. SPSS IBM Statistics 26 was used to analyze data, create frequency and percentage tables, and test hypotheses. The inferential analysis included the correlation analysis of research constructs, multiple regression analysis to test the main research hypotheses, and cross-sectional study.
Results: Cronbach's Alpha deemed the questionnaire internally consistent and reliable. The respondents were greatly satisfied with the dental services provided in private healthcare centers in Mauritius. The p-values in the regression coefficients show that all three predictors had significant positive impacts on Overall satisfaction at the 1% level: Satisfaction with Dentists' Performance (β = .307, t = 5.292, p < .001), Satisfaction with Dental Assistants (β = .415, t = 6.611, p < .001) and Satisfaction with Non-Clinical Dental Services (β = .171, t = 2.988, p =.003). Satisfaction with Dental Assistants had the highest impact on Overall satisfaction for patients attending private health institutions. Patients over 60 years were significantly more satisfied than those aged 18-40 (t = 2.649, p = 0.048) at the 5 % level. Females were significantly more comfortable compared to their male counterparts at the 1% level, and patients who attended secondary school were meaningfully more satisfied than those who attended primary school (t = -3.017, p = 0.008) at the 1% level.
Conclusions: Patients were satisfied with the Dentists' Performance, the performance of the Dental Assistants, and the quality of the non-clinical Dental Services. Satisfaction with Dental assistants had the highest impact on Overall satisfaction. Age group, gender, and level of education impacted the overall patient satisfaction in dental private healthcare centers in Mauritius.
Keywords: Patients' Satisfaction; Private health care centers in Mauritius.
Introduction
'Simply practicing dentistry with a high degree of technical expertise will not necessarily convince the patient that he has received high-quality dental care. Other less technical aspects of dental treatment are recognized as being barometers of the quality of dental treatment. Practitioners should keep sight of care's human and psychological factors and remember that they are integral components of quality in dental treatment [1].
Donabedian proposes that health services be evaluated according to structure, work process, results, and user satisfaction [2]. Studying patients' satisfaction with dental care is a valuable tool for assessing the quality of dental care and raising patient awareness of care and the services provided in a given hospital. The factors of dental care satisfaction identified are the technical quality of care, interpersonal aspects, accessibility, availability, financial access, outcome, efficacy, continuity of care, facilities, or attitude about overall care [3].
A small island nation, Mauritius is about 2,000 kilometers from the southeast coast of Africa. The country is 2,040 square kilometers, but its exclusive ocean economic zone is 2,300,000 square kilometers. It has 1.3 million people. Health care is well-developed in Mauritius. Public health organizations provide about 73 % of the population's healthcare needs, while the private sector handles 27 %. Mauritius is one of the few nations in the Sub-Saharan African region with a robust healthcare system working toward universal health coverage. In 2017, Mauritius' UHC Service Coverage Index was 65%. The Global monitoring report 2021 places Mauritius third in the region, placing it well above its average (UHC Service Coverage Index), which stands at 42 % [4].
In light of the above, the study has been designed to determine the degree of patient satisfaction at Mauritius' private dental healthcare facilities. Data was collected through a survey to understand better the factors associated with Mauritian patient satisfaction in seven private dental healthcare centers nationwide. The different dimensions of patient Satisfaction in the private dental healthcare centers in Mauritius were then evaluated.
Materials and Methodology
A sample of 271 participants from 7 private dental health care centers was considered for this study from October to December 2022. A validated questionnaire (Appendix) with a standard 5-point scale (Likert-type) was used. The range was from; 1 - Strongly dissatisfied, 2 - "Dissatisfied," 3 - "Neutral," 4 - "Satisfied," and 5 - "Strongly satisfied.
The participants completed a self-administered questionnaire, which consisted of four research constructs:
1. The clinical dental services construct, which focused on the dentist's performance, included inquiries about the accessibility of dentists as well as questions about the dentist's communication abilities, which were shown by their ability to attend to patients and give them proper explanations before and after treatment.
2. Questions on the accessibility of dental assistants and their responsiveness to patients' demands made up the clinical dental services construct, which was about the dental assistant domain.
3. There were three components to the non-clinical services construct: Part 1: The availability of dental care was assessed, including the ease of securing convenient appointment times, appointment wait times, and the time spent waiting before seeing the dentist.
Part 2: The adequacy of the interior design and the seat availability in the waiting room were considered when evaluating the reception's physical appearance.
Part 3: To assess the receptionists' performance, questions were asked on how effectively patients are welcomed, how simple it is to get suitable days and times for appointments, and how quickly and accurately data is entered.
4. The questionnaire also asked about the patient's general satisfaction with the treatment outcomes, the speed with which they were seen, and the infection-control and sterilizing procedures. Gender, age, and educational level were sociodemographic factors that were also considered.
Research protocol
1. All patients who attended the clinics during the study period were briefed about the aim of the study. A consent form was given to each patient.
2. Only those willing to participate filled in the questionnaire.
3. Subjects were informed that participating or not participating had no adverse consequence on the treatment they would receive on that day or any other day after that.
4. Every participant was assured of the confidentiality of the information given and that the information will be used for scientific purposes only.
5. Inclusion: All patients willing to participate in a survey
6. Exclusion: Patients not willing to participate
Statistical analysis
For data analysis, this study used both IBM SPSS Statistics 26 and Microsoft Excel 2019. Data from the survey was first entered into an Excel spreadsheet, then cleaned up and exported to SPSS. Excel was used to illustrate results on charts. IBM SPSS Statistics 26 was utilized to process the data, create tables of frequencies and percentages, and test hypotheses. Cross-sectional analysis, multiple regression testing of the primary research hypotheses, and correlation analysis of research constructs were all examples of inferential analysis.
Results
Data Testing
To bring more credibility and trustworthiness to the analysis results and research findings, data were tested for reliability, construct validity, and sample adequacy in SPSS, even though statistically significant samples of 271 were obtained from private dental health care centers.
Reliability
According to Wiener et al.[5], reliability is "the degree to which the items assessing a concept demonstrate internal consistency." For this reason, the reliability of the replies to the four sets of statements under "Satisfaction with Dentists' Performance," "Satisfaction with Dental Assistants," "Satisfaction with Non-Clinical Dental Services," and "Overall Satisfaction" was examined. When a measuring tool includes multiple statements of the Likert kind, Cronbach's Alpha is the most acceptable internal consistency metric, according to Laerd Statistics [6]. The results regarding the patients' dependability are shown in Table 1.
Table 1: Reliability Test Results
|
|
No. of items |
Cronbach Alpha Coefficient |
|
Satisfaction with Dentists’ Performance |
5 |
0.852 |
|
Satisfaction with Dental Assistants |
5 |
0.900 |
|
Satisfaction with Non-Clinical Dental Services |
7 |
0.891 |
|
Overall Satisfaction |
3 |
0.844 |
According to earlier studies, dependability coefficients should have a lower bound[7]of 0.6 and an upper range [8] of 0.95 for satisfactory internal consistency. The survey questionnaire was declared internally consistent because all four reliability coefficients fell within these ranges.
Test results for Construct Validity and Sample Adequacy.
According to Wiener et al., validity relates to the extent to which a measure is considered to reflect, or theoretically connected to, some construct of interest. The validity construct of the survey was evaluated using SPSS using factor validity [9]. The significance of Bartlett's test of sphericity was examined using a principal component analysis of the replies to each of the four sets of Likert-type statements. Additionally, SPSS assessed the Kaiser Meyer Olkin statistic to assess the appropriateness of the sample. Table 5.2 below shows the results for construct validity and sample adequacy.
Table 2: Test results for construct validity and sample adequacy
|
|
Bartlett test of Sphericity (Validity) |
KMO-Statistics (Sample adequacy) |
|
Satisfaction with Dentists’ Performance |
< 0.001 |
0.846 |
|
Satisfaction with Dental Assistant |
< 0.001 |
0.832 |
|
Satisfaction with Non-Clinical Dental Services |
< 0.001 |
0.894 |
|
Overall Satisfaction |
< 0.001 |
0.715 |
The four sets of statements passed the construct validity testing for patients from private health facilities, as shown by the fact that all of the p-values attained for Bartlett's test were significant at the 5 % level [10]. Additionally, all eight of the KMO values were at least 0.5, indicating that the data was amenable to multivariate statistical methods such multiple regression analysis.
Demographics
Table 3: Demographic profile of patients
|
Variables |
Categories |
(n = 271) |
|
|
Frequency |
Percentage |
||
|
Age group (years) |
Less than 18 |
28 |
10.4 |
|
|
18 – 40 |
129 |
48.2 |
|
|
41 – 60 |
77 |
28.7 |
|
|
More than 60 |
34 |
12.7 |
|
Gender |
Male |
98 |
36.8 |
|
|
Female |
168 |
63.2 |
|
Level of education |
Primary |
11 |
4.2 |
|
|
Secondary |
120 |
46.2 |
|
|
Tertiary |
129 |
49.6 |
*All three demographic variables had missing values
Salient Demographic Figures
In Table 3, Patients between the ages of 18 and 40 made up 48.1 % of the population, while patients between the ages of 41 and 60 made up 28.7 %.
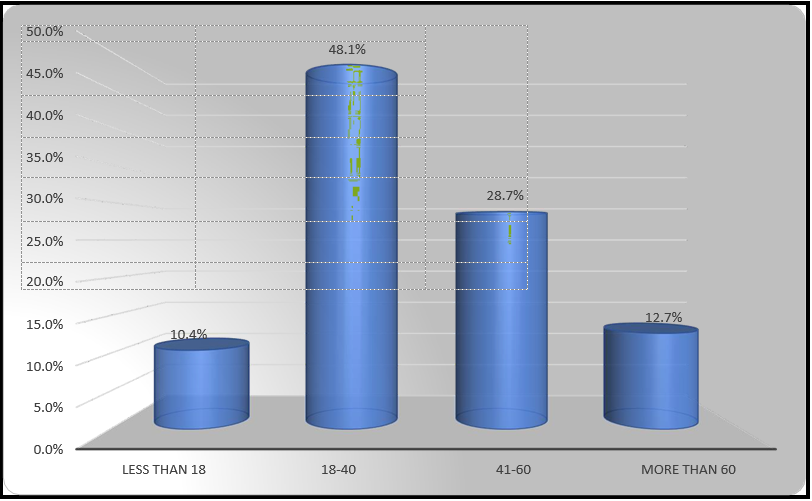
Figure 1: Age group
With regards to gender, there were more female (63.2%) in the sample collected.
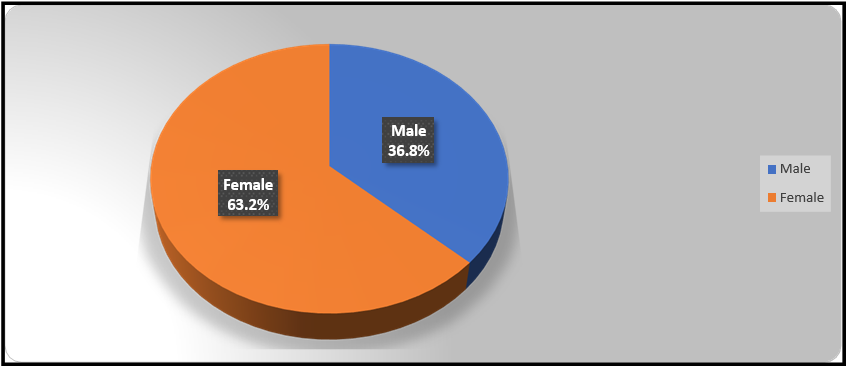
Figure 2: Gender
In terms of level of education, 46.2% and 49.6% of patients studied up to secondary and tertiary levels respectively.
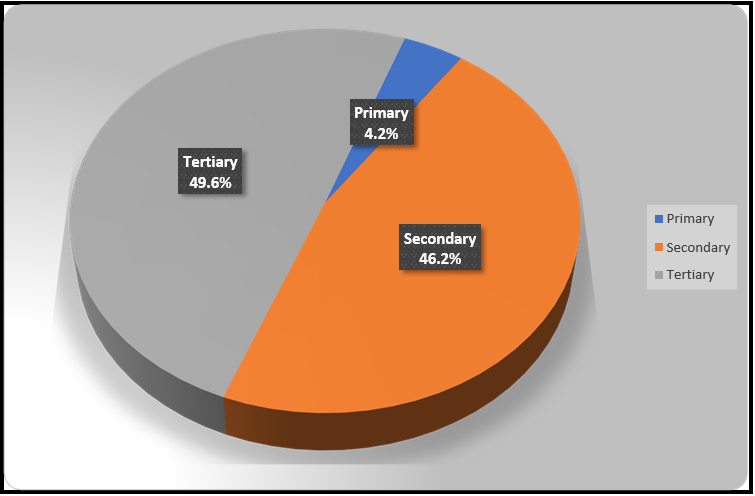
Figure 3: Education level
Analysis
According to the administered questionnaire (in the Appendix), the responses provided by patients under the four study constructs have been analysed descriptively using the weighted means approach[11].
When weighing the Likert alternatives, a mean and standard deviation were calculated for each statement.
Satisfaction with Dentists’ Performance (Mean Scores)
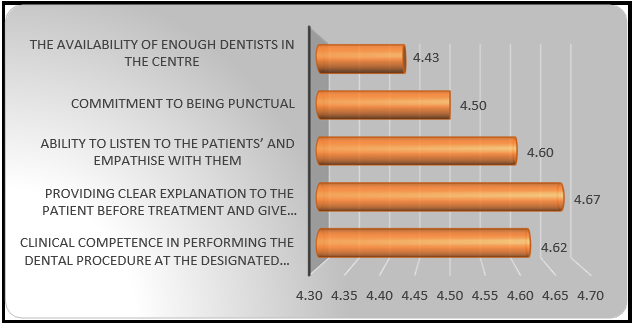
Figure 4: Satisfaction with dentists’ performance
The above bar chart (Figure 4) shows that all the mean satisfaction scores for patients from private health institutions.
Table 4: Satisfaction with dentists’ performance
|
Satisfaction with dentists’ performance |
Mean |
SD |
|
The capacity to empathize with and listen to patients |
4.43 |
0.67 |
|
Commitment to being punctual |
4.50 |
0.70 |
|
Ability to listen to the patients and empathise with them |
4.60 |
0.62 |
|
Providing clear explanations to the patient before treatment and give post treatment instructions |
4.67 |
0.57 |
|
Clinical ability to complete the dental surgery within the allotted time range |
4.62 |
0.59 |
** Significant at the 1 % level
Respondents expressed satisfaction. Their level of happiness with giving patients comprehensive explanations prior to treatment and delivering post-treatment instructions was greatest, while their level of satisfaction with the centre’s ability to accommodate more dentists was lowest.
Satisfaction with Dental Assistants
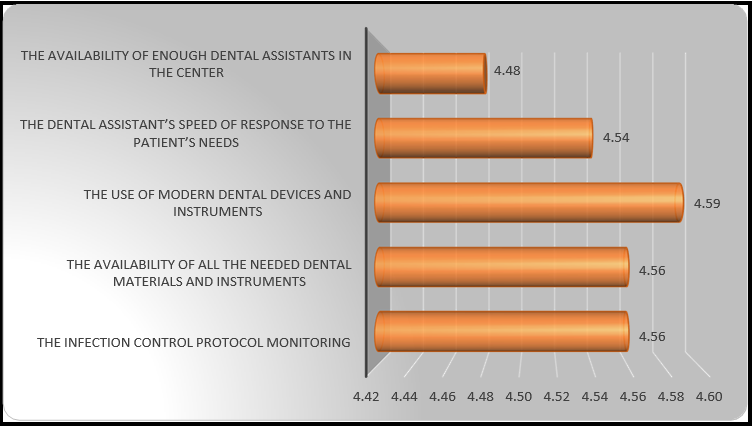
Figure 5: Satisfaction with Dental Assistants (Mean Scores) below shows the means obtained in relation to patients’ satisfaction with dental assistants from private institutions.
Table 5: Satisfaction with dental assistants
|
Satisfaction with dental assistants |
Mean |
SD |
|
There being enough dental assistants at the clinic |
4.48 |
0.66 |
|
Response time of the dental assistant when a patient has a need |
4.54 |
0.60 |
|
the utilization of contemporary dental tools and equipment |
4.59 |
0.62 |
|
the accessibility of all necessary dental supplies and equipment |
4.56 |
0.64 |
|
The infection control protocol monitoring |
4.56 |
0.66 |
** Significant at the 1 % level
Respondents expressed satisfaction. Their level of satisfaction with the utilization of contemporary dental tools and equipment was highest, while their level of happiness with the centre’s ability to staff enough dental assistants was lowest.
Satisfaction with Non-Clinical Dental Services
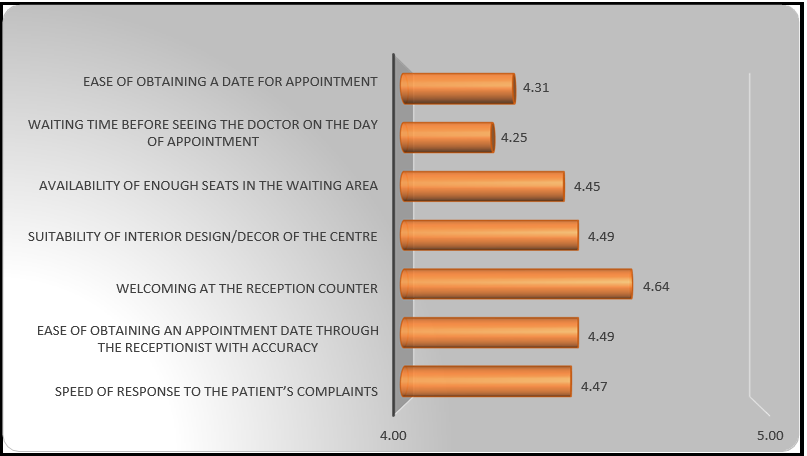
Figure 6: Satisfaction with Non-Clinical Dental Services (Mean Scores)
Table 6: Satisfaction with Non-Clinical Dental Services
|
Statements |
Mean |
SD |
|
Ease of obtaining a date for appointment |
4.31 |
0.82 |
|
waiting period on the scheduled appointment day before seeing the doctor |
4.25 |
0.79 |
|
There are sufficient seats in the waiting area. |
4.45 |
0.65 |
|
suitability of the centre’s interior decor |
4.49 |
0.67 |
|
Welcoming at the reception counter |
4.64 |
0.55 |
|
Ease of obtaining an appointment date through the receptionist with accuracy |
4.49 |
0.70 |
|
Response time to complaints from patients |
4.47 |
0.68 |
* Significant at the 5 % level; ** Significant at the 1% level
Respondents expressed satisfaction. Their level of pleasure with being greeted at the front desk was the highest, whereas their level of satisfaction waiting time before seeing the dentist on the scheduled appointment day was the lowest.
Overall Satisfaction
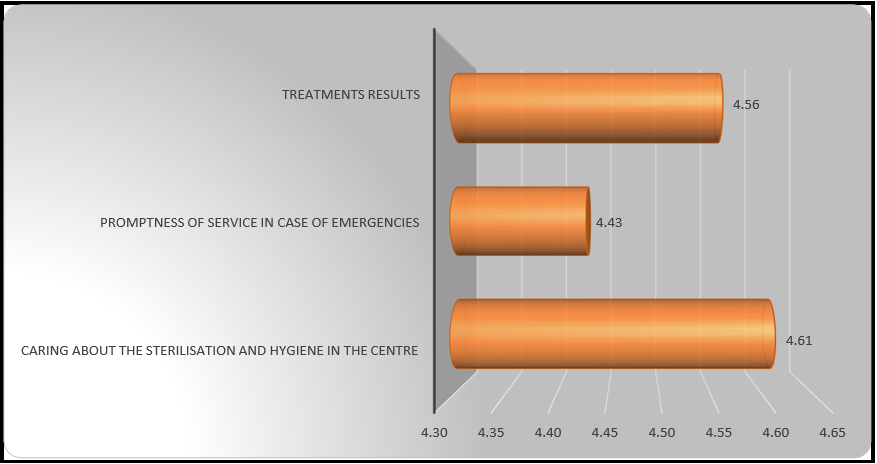
Figure 7: Overall satisfaction
Table 7: Overall satisfaction
|
Overall satisfaction |
Mean |
SD |
|
Treatments results |
4.56 |
0.58 |
|
Promptness of service in case of emergencies |
4.43 |
0.70 |
|
Caring about the sterilisation and hygiene in the centre |
4.64 |
0.54 |
** Significant at the 1 % level
The respondents were satisfied. Their satisfaction for caring about the sterilisation and hygiene in the centre was highest while their satisfaction towards promptness of service in case of emergencies was lowest
Inferential Analysis
Correlation Analysis
Before testing a multiple regression model for patients, correlation analysis was done, with the dependent variable being the proposed predictors for overall satisfaction, including satisfaction with the performance of dentists, satisfaction with dental assistants, and satisfaction with non-clinical dental services. Pearson's coefficient was used to get the general means of the mean scores for every four components to determine the correlations. Table 8 gives the correlation coefficients computed using SPSS.
Table 8: Correlation matrix of constructs
|
Constructs |
(1) |
(2) |
(3) |
(4) |
|
(1) Satisfaction with Dentists’ Performance |
1 |
|
|
|
|
(2) Satisfaction with Dental Assistants |
.761** |
1 |
|
|
|
(3) Satisfaction with Non-Clinical Dental Services |
.703** |
.752** |
1 |
|
|
(4) Overall Satisfaction |
.741** |
.776** |
.697** |
1 |
** p < 0.01
It is observed that the correlations among the independent constructs were not only significantly and positively correlated with one another, but also with Overall Satisfaction at the 1% level. Thus, there was no doubt that these results justified the testing of a multiple regression model, especially given that correlation need not imply causality[12].
Analysis for Multiple Regression
The analysis for multiple regression was done to regulate the significance of the impacts of Satisfaction with Dentists’ Performance, Satisfaction with Dental Assistants and Satisfaction with Non-Clinical Dental Services on the dependent variable Overall Satisfaction for the patients surveyed. In each case, three hypotheses were to be tested, as formulated below:
Hypothesis 1
H0: Satisfaction with Dentists’ Performance has no impact on Overall Satisfaction
H1: Satisfaction with Dentists’ Performance has an important positive impact on Overall Satisfaction
Hypothesis 2
H0: Satisfaction with Dental Assistants has no impact on Overall Satisfaction
H1: Satisfaction with Dental Assistants has a significant positive impact on Overall Satisfaction
Hypothesis 3
H0: Satisfaction with Non-Clinical Dental Services has no impact on Overall Satisfaction
H1: Satisfaction with Non-Clinical Dental Services has an important positive impact on Overall Satisfaction.
Reporting of Results
Table 9: Model Summary
|
Model |
R |
R Square |
Adjusted R Square |
Std. Error of the Estimate |
Change Statistics |
||
|
R Square Change |
F Change |
Sig. F Change |
|||||
|
1 |
.818a |
.668 |
.664 |
.30870 |
.668 |
171.306 |
.000 |
|
a. (Constant), Satisfaction with Dentists’ Performance, Satisfaction with Dental Assistants, Satisfaction with Non-Clinical Dental Services |
|||||||
|
b. Dependent variable: Overall Satisfaction |
|||||||
Patients attending private health institutions, the multiple regression model was significant at the 1 % level (p < 0.01), as shown in Table 9. Moreover, the predictors explained 66.8 % of the shared variance with Overall Satisfaction, meaning that the model was right for the data.
Table 10: Regression coefficients
|
Model |
Unstandardized Coefficients |
Standardized Coefficients |
|
||
|
B |
Std. Error |
Beta |
t |
Sig. |
|
|
(Constant) |
.465 |
.182 |
|
2.550 |
.011 |
|
Satisfaction with Dentists’ Performance |
.323 |
.061 |
.307 |
5.292 |
.000 |
|
Satisfaction with Dental Assistants |
.412 |
.062 |
.415 |
6.611 |
.000 |
|
Satisfaction with Non-Clinical Dental Services |
.165 |
.055 |
.171 |
2.988 |
.003 |
|
a. Dependent Variable: Overall Satisfaction |
|||||
The p-values of regression coefficients (Table 10) shows that all three predictors had significant positive impacts on Overall Satisfaction at the 1 % level: Satisfaction with Dentists’ Performance (β = .307, t = 5.292, p < .001), Satisfaction with Dental Assistants (β = .415, t = 6.611, p < .001) and Satisfaction with Non-Clinical Dental Services (β = .171, t = 2.988, p = .003). Satisfaction with Dental Assistants had the highest impact on Overall Satisfaction for patients attending private health institutions, with a β-coefficient of magnitude .415. Therefore, all three null hypotheses were rejected at the 1 % level.
Cross-Sectional Analysis
In order to determine whether the patients' demographic features were related to their overall happiness, a cross-sectional analysis was carried out. Given that the sample size was smaller than 2000, the Shapiro-Wilk test in SPSS was first used to determine whether the test variable Overall Satisfaction was normal[13]. Determining whether to utilize parametric or non-parametric tests required doing a normality test. The table below contains the findings.
Table 11: Normality Test (Shapiro-Wilk)
|
|
Statistic |
df |
Sig. |
|
Overall Satisfaction |
.796 |
260 |
.000 |
a. Lilliefors Significance Correction
The data above demonstrate that Overall Satisfaction was not normally distributed, and the p-value was significant at the 1% level. The Mann-Whitney U test was utilised for gender (a dichotomous variable), and the Kruskal-Wallis H test was utilised for age group and education level (multichotomous variables).
Table 12 below gives a summary of the SPSS output tables. The significant associations would be further examined using descriptive statistics for gender as well as non-parametric post hoc tests via pairwise comparisons for age group and education level in SPSS to identify significant difference(s) between overall satisfaction among the subscales of relevant demographic variables.
Table 12: Association between patients’ demographic characteristics and their overall satisfaction
|
Mann-Whitney U or Kruskal-Wallis H tests |
||
|
|
test-statistic |
p-values |
|
Age group |
9.134 |
0.028* |
|
Gender |
2.684 |
0.007** |
|
Education level |
12.162 |
0.002** |
* p < 0.05; ** p < 0.01
The above p-values show that, for patients attending private health institutions, Overall Satisfaction was significantly associated with age group, gender and education level. Thus, age group (c2 = 9.134, p = 0.028) was significant at the 5% level, while gender (t = 2.684, p = 0.007) and education level (c2 = 12.162, p = 0.002) were significant at the 1% level.
Age group
Table 13: Age group Pairwise comparisons below shows the results of non-parametric post hoc test for age group, as output by SPSS.
|
Sample 1-Sample 2 |
Test Statistic |
Std. Error |
Std. Test Statistic |
Sig. |
Adj. Sig.a |
|
More than 60 - 41-60 |
23.083 |
14.764 |
1.563 |
.118 |
.708 |
|
More than 60 - 18-40 |
36.575 |
13.808 |
2.649 |
.008 |
.048 |
|
More than 60 - Less than 18 |
45.600 |
18.020 |
2.531 |
.011 |
.068 |
|
41-60 - 18-40 |
13.492 |
10.273 |
1.313 |
.189 |
1.000 |
|
41-60 - Less than 18 |
22.518 |
15.480 |
1.455 |
.146 |
.875 |
|
18-40 - Less than 18 |
9.025 |
14.570 |
.619 |
.536 |
1.000 |
|
Each row tests the null hypothesis that the Sample 1 and Sample 2 distributions are the same. Asymptotic significances (2-sided tests) are displayed. The significance level is .05. |
|||||
|
a. Significance values have been adjusted by the Bonferroni correction for multiple tests. |
|||||
The p-values in Table 13 above show only one significant difference was identified, namely that patients aged more than 60 years were significantly more satisfied than those aged 18-40 years (t = 2.649, p = 0.048) at the 5% level.
Gender
The result for gender (Male, Female) was also deduced from descriptive statistics to determine the subscale that was more satisfied.
Table.14: Descriptive Statistics
|
Gender |
N |
Mean |
Std. Deviation |
|
Male |
94 |
4.4238 |
.56621 |
|
Female |
161 |
4.6004 |
.50252 |
The p-value of 0.007 obtained for the association between gender and Overall Satisfaction (Table 14) mean that female patients were significantly more satisfied, as compared to their male counterparts at the 1 % level.
Education level
There was just one significant variation in the subscales of level of education, in Table 5.15 below. Figures demonstrate that patients who attended primary school reported much lower levels of satisfaction than those who attended higher level of schooling (t = -3.017, p = 0.008 at the 1 % level).
Table 15: Pairwise comparisons of Education level
|
Sample 1-Sample 2 |
Test Statistic |
Std. Error |
Std. Test Statistic |
Sig. |
Adj. Sig.a |
|
Primary – Tertiary |
-46.854 |
22.218 |
-2.109 |
.035 |
.105 |
|
Primary – Secondary |
-67.370 |
22.327 |
-3.017 |
.003 |
.008 |
|
Tertiary – Secondary |
20.516 |
8.769 |
2.340 |
.019 |
.058 |
|
Each row tests the null hypothesis that the Sample 1 and Sample 2 distributions are the same. Asymptotic significances (2-sided tests) are displayed. The significance level is .05. |
|||||
|
a. Significance values have been adjusted by the Bonferroni correction for multiple tests. |
|||||
Discussion
Richer (1995)[14] wrote, 'Most businesses make the mistake of measuring their performance in terms of figures when they ought to be measuring it in terms of people. The primary measure of a business's success should be customer satisfaction, not profits. Profits are simply an indicator that you are getting customer service right. Anyone can play around with prices to push sales and turnover up. You can mess around with margins and hammer costs to make profits look good. But these are short-term ticks. Unless the customer is happy, the business will not last.' Various studies have investigated the relationships between multiple factors impacting patients' satisfaction with dental care and how to use the elements affecting patients' happiness to improve the quality of the provision of dental services. However, the findings tend to be contradictory, as the factors do not operate in isolation but interplay.
Similarly, to Dena et al.[15], in this study, satisfaction with Dentists' Performance had the most significant impact on overall patient satisfaction. A high satisfaction score for the explanation given by dentists indicates that the dentist in the studied clinics described the patients' expectations. This may result from the recently established continuing education program wherein dentists must attend seminars, conferences, and workshops to keep up with the latest developments in dentistry and, most importantly, renew their practicing licenses each year.
The private dental health care centers scored a high satisfaction level concerning all four aspects of the study: the dentists' performance, the non-clinical dental services, the overall patient satisfaction, and the highest level of the dental assistants' performance. This can be explained by the dental assistant's role as the patient's first contact before meeting the dentist to determine the patient's complaint. With the proper communication skills, patients may feel more comfortable communicating their complaints to the dental assistant. While the dentist focuses on the teeth, the dental assistant also lets them know if the patient is in pain or discomfort. When this happens, the dental assistant becomes the bridge between the dentist and the patient. In this circumstance, only a supportive dental assistant with excellent etiquette can account for increased satisfaction [16].
From a demographic point of view, the dominant age groups were 18- 40, followed by 41-60 were noted. Stege [17] reported that patients over 60 were more satisfied with their dental care than younger patients, whereas Lahti et al. [18] found older patients less comfortable. This study concluded that patients above 60 years were more satisfied than patients group 18 to 40 years. Higher tolerance levels and the potential for more excellent courtesy and caution on the part of experts when working with this demographic are two possible explanations for why older individuals report feeling more satisfied. There may also be a cohort effect, where older persons have lower expectations based on earlier experiences or if the evaluation criteria are altered according to particular values in the cohort [19].
Regarding gender, this study pointed out that females were significantly more satisfied with care than their male counterparts. Gopalkrishna and Mummalaneni [20] found that men showed lower levels of satisfaction with dental care than women. This was attributed to women having greater exposure to dental services than men, making them more moderate with their expectations compared to men. This is further corroborated by Zarzycka et al.[21]in their separate submission.
Among patients from private dental healthcare centers, 46.2 % and 49.6 % studied up to secondary and tertiary levels, respectively. More highly educated patients might have more knowledge and expectations regarding the dental services being provided and the quality of dental care. Unlike other studies,[22,23] this study has found that highly educated patients were more satisfied. Another plausible explanation is that the extent felt listened to and the reason given by practitioners are likely to capture the attention of people with higher education than those with lower education. Lastly, the poor response from people who studied up to primary education might be due to poor literacy and their inability to answer the questionnaires.
Recommendations
The high level of patient satisfaction in private health care centers in Mauritius recorded in this study should not be taken as a permanent state of affairs. Patients' needs, perceptions, and expectations change and depend on many factors. Some recommendations made based on this study are:
- Private healthcare facilities can use information from patient satisfaction surveys to improve their competitiveness, profitability, credibility, growth, and sustainability. Therefore, such patient satisfaction evaluations must be conducted consistently and regularly to track improvements in the caliber of dental treatments provided by private healthcare facilities.
- Private healthcare centers should strive to maintain and improve patients' satisfaction in terms of satisfying their needs and expectations to offer Quality dental care services.
- The study results will enable private healthcare centers to establish a baseline understanding of patients' evaluations, which might be used to alter and enhance institutional behaviors for the benefit of both the facilities and the patients.
Limitations
This study has covered the essential patient satisfaction indicators in dental care services. However, there are some limitations of the study, which are:
- The study was conducted exclusively for private institutions. There were no data from other kinds of institutions included.
- The high level of patient satisfaction in private healthcare facilities in Mauritius noted in this study may be due to patients' reluctance to voice unfavorable remarks about service providers or a need for more clarity and precision in the questions asked.
- Visit-specific factors, such as the type of procedure (preventive vs. restorative) and pain experience, may impact the patient's experience and satisfaction. These data were not gathered. Patients are happier when they have undergone easier, less upsetting care components.
- Not all private dental health care centers have been covered.
- Not all patients were willing to fill out the survey form.
Conclusion
The study shows that the respondents were satisfied with the dental services provided in private healthcare centers in Mauritius. The patients surveyed were happy with the Dentists' Performance, the performance of the Dental Assistants, and the quality of the non-clinical Dental Services. Satisfaction with Dental Assistants had the highest impact on Overall satisfaction for patients attending private health institutions. It was observed that Age group, gender, and level of education impacted the overall patient satisfaction in dental private healthcare centers in Mauritius.
References
- Abrams RA, Ayers CS, Vogt Petterson M (1986) Quality assessment of dental restorations: a comparison by dentists and patients. Community dentistry and oral epidemiology. 14(6): 317- 319.
- Donabedian A (1988) The quality of care: How can it be assessed? JAMA. 260(12): 1743–1748.
- Ware JE Jr, Snyder MK, Wright WR, Davies AR (1983) Defining and measuring patient satisfaction with Medical care. Evaluation and Program Planning. 6(3-4): 247-263.
- Global Monitoring Report. 2021. Tracking universal health coverage. World Health Organization.
- Weiner BJ, Lewis CC, Stanick C, Powell BJ, Dorsey CN, et al. (2017) Psychometric assessment of three newly developed implementation outcome measures. Implementation Science. 12(1): 108.
- Laerd Statistics, 2018. Cronbach's Alpha (α) using SPSS Statistics.
- Malhotra NK (2019) Marketing research: An applied orientation. 7th ed. Upper Saddle River, NJ: Pearson/Prentice Hall.
- Karandashev V, Evans ND (2017) Test of Implicit Associations in Relationship Attitudes (TIARA): Manual for a New Method. Springer.
- Abraham J, Barker K (2014) Exploring gender difference in motivation, engagement and enrolment behaviour of senior secondary physics students in New South Wales. Research in Science Education. 45(1): 59-73.
- Field A (2016) Discovering Statistics Using IBM SPSS Statistics. 4th ed. London: Sage Publications Ltd.
- Glen S (2014) Weighted Mean: Formula: How to Find Weighted Mean.
- Singh S (2018) Why does correlation not imply causation?
- Laerd Statistics. Testing for Normality using SPSS Statistics.
- Richer J (1995) The Richer Way Emap Business Communications. London.
- Ali DA (2016) Patient satisfaction in Dental Healthcare centres. Eur J Dent. 10(3): 309-314.
- Holt VP, McHugh K (1997) Factors influencing patient loyalty to dentist and dental practice. Br Dent J. 183(10): 365–370.
- Stege PM, Handelman SL, Baric JM, Espeland M (1986) Satisfaction of the older patient with dental care. Gerodontics. 2(5): 171–174.
- Lahti S, Hausen H, Kääriäinen R (1996) Patients’ expectations of an ideal dentist and their views concerning the dentist they visited: Do the views conform to the expectations and what determines how well they conform?. Community Dent Oral Epidemiol. 24(4): 240–244.
- Aspinal F, Addington-Hall J, Hughes R, Higginson IJ (2003) Using satisfaction to measure the quality of palliative care: a review of the literature. J Adv Nurs. 42(4): 324-39.
- Gopalakrishna P, Munnaleneni V (1993) Influencing satisfaction for dental services. J Health Care Mark. 13(1): 16-22.
- Zarzycka D, Bartoń E, Mazur A, Turowski K (2019) Sociodemographic and medical factors associated with patients ’satisfaction with nursing care and their perception of pain. Ann Agric Environ Med. 26(2): 298-303.
- Ministry of Health Kuwait, Dental Administration. Annual Dental Sector Report. 31st ed. Kuwait: Ministry of Health; 2012.
- Hashim R (2005) Patients satisfaction with dental services at Ajman University, United Arab Emirates. Eastern Mediterr Health J. 11(5-6): 913-921.