


María Tula Cuevas Acuña1*, Paulina Cortes Hernández2, Maria de la Luz León Vázquez3, Jose Abraham García Torres4, Eleazar Mancilla Hernández5
1Hospital General de Zona No. 2 IMSS Apizaco Tlaxcala
2Centro de Investigación Biomédica de Oriente (CIBIOR), IMSS Puebla.
3Instituto Mexicano del Seguro Social Tlaxcala
4Hospital General de Zona No. 2 IMSS Apizaco Tlaxcala
5Colegio de Postgrado del Área de la Salud de Puebla
*Corresponding Author: María Tula Cuevas Acuña, Hospital General de Zona No. 2 IMSS Apizaco Tlaxcala.
Abstract
Patients with Type 2 Diabetes Mellitus (DM2) without glycemic control may have more significant inflammation and higher lymphocyte neutrophil index (INL). The INL studied in other diseases may help monitor patients with DM2.
The objective was to determine if the INL level is related to glycemic lack of control in DM2 patients without complications and to identify associated risk factors.
Material and Methods: Observational, analytical, cross-sectional study; included patients with DM2, without complications, somatometry (weight and height), INL, cholesterol, triglycerides, and glucose were obtained, they were classified with and without glycemic control using glycosylated hemoglobin (HbA1c) ≤7% or ≥7.1%. Descriptive analysis was performed, in addition to Kruskall Wallis, Mann-Whitney U, X2 Pearson, binary logistic regression, and ROC curve with SPSS statistical program.
Results: 369 patients were included, 62.6% women, DM2 evolution 10.3 years ± 8.9 years. The mean INL was 1.75; 39% had glycemic control. There was no difference in INL for age, gender, arterial hypertension, or comorbidities. The ROC curve with an INL cutoff of 1.64 showed a sensitivity of 0.53 and a specificity of 0.59. A risk factor for glycemic lack of control was considered DM2 with more than 10 years of evolution, insulin use, INL ≥ 1.66, and glucose ≥ 131mg/dl (p < 0.05).
Conclusions: In patients with DM2 without complications, INL 1.7 was a risk factor for glycemic imbalance, although with low sensitivity and specificity. The longer the evolution of the disease, the higher the INL, cholesterol, glucose, and insulin use levels.
Keywords: Neutrophil/lymphocyte ratio, INL, Type 2 Diabetes Mellitus, HbA1c, glycemic control
Introduction
Type 2 Diabetes Mellitus (DM2) is the chronic disease responsible for 14.3% of deaths in Mexico [1]. In 2022, a prevalence of 18.3% was estimated; 5.8% of patients were unknown with the disease [2]. DM2 increases the risk of ischemic heart disease and cerebrovascular disease; in people of productive age, it is the leading cause of blindness and non-traumatic lower limb amputation as well as chronic kidney disease in renal replacement therapy [3-6], reducing the hope of life up to 10 years [6,7].
80% of deaths from DM2 occur in low- and middle-income countries [8]; in Mexico, patients with DM2 consumed approximately 15.5% of the health budget in 2017, estimated to cost 83 billion pesos [9].
The etiology of DM2 is complex and multifactorial. Defective insulin secretion by β cells, subject to metabolic-oxidative stress, endoplasmic reticulum stress with loss of pancreatic islet function, tissue resistance to insulin, genetic predisposition, and environmental triggers lead to disease expression (10, eleven).
Some studies have shown that obese patients with insulin resistance maintain a state of chronic low-grade inflammation, and the increase in inflammatory cytokines precedes DM2 [12]. Inflammatory cytokines such as Tumor Necrosis Factor α (TNFα), interleukin 6 (IL6), and interleukin 1β (IL1β) are secreted by acute or chronic inflammatory stimuli, produced mainly by liver macrophages and adipose tissue adipocytes under cellular stress [12-14]. The liver responds with decreased glucose uptake, hyperglycemia, increased C- reactive protein (CRP), and other inflammatory proteins [13]. Inflammation generates direct damage and deterioration of β cells [15].
The neutrophil/lymphocyte ratio (NLR), a non-specific inflammatory biomarker, has been studied in coronary heart disease, atherosclerosis, obesity with insulin resistance, sepsis, cancer, and COVID-19. It is an accessible and inexpensive tool determined from neutrophils, non-specific mediators of inflammation, and lymphocytes that regulate inflammatory processes and participate in acquired immunity [16-18].
The average value of INL in healthy subjects, according to Forget, was 1.65 [19]. The National Health and Nutrition Examination Survey (NHANES) reported different INL values according to race: Hispanics 2.08, whites 2.24, African-Americans 1.76, and patients with DM2 2.34 [20].
It has been shown that INL in patients with DM2 can be a predictor of microvascular complications and coronary artery disease [21], being 1.14 times higher in patients with microvascular complications
[22]; other researchers have reported higher INL in patients without glycemia. . control compared to those in power (2.4 vs. 1.5) [23]. Therefore, the study aimed to determine if the INL level was related to glycemic lack of control in patients with DM2 without complications and to identify associated risk factors.
Material and Methods
An observational, analytical, cross-sectional study was carried out at the first level of care at the Hospital General de Zona con Medicina Familiar No 2 of the Mexican Institute of Social Security (IMSS) in Apizaco Tlaxcala. A sample calculation was made according to the population formula for a group (considering 5945 patients with DM2 who come for control), with a confidence level of 95% and an error of 0.05, giving a total of 360 patients. Patients with DM2, older than 30 years, more than one year of diagnosis of the disease, without complications, both genders were included. Pregnant women, presence of autoimmune and rheumatic diseases, cancer under treatment, cardiovascular or cerebrovascular event in the last year, surgery in the previous 6 months, acute inflammatory process or infectious process in the last week, diabetic nephropathy, replacement treatment with dialysis were excluded. Or hemodialysis, as well as those with leukocyte counts < 4000 or > 12,000, hemoglobin (Hb) ≤ 10 mg/dl, or serum creatinine > 1.6 mg/dl.
The protocol was approved by the local research committee, registration R-2021-2902-030. With the prior informed consent of the participants, a previously structured questionnaire was applied for general information such as age, sex, complications, complications, and comorbidities. In the end, blood pressure (BP) was taken, as well as weight and height, to calculate and classify BMI as normal. ≤25 and tall ≥25.1 kg/m2. Glucose, HbA1c, complete blood count (BH), urea, creatinine, cholesterol, and triglycerides were requested. According to the glycemic control goals of the Clinical Practice Guide (GPC) [24], they were classified as controlled DM2 with HbA1c ≤7% and glucose ≤130 mg/dl and without glycemic control with ≥7.1% or ≥131 mg/dL respectively. The INL was calculated and classified as normal ≤1.65 or elevated ≥1.66 according to healthy subjects [19].
For the descriptive analysis, frequency and percentage were used for qualitative variables, and quantitative variables were measures of central tendency (mean and IQR) and dispersion (standard deviation). The inferential analysis, according to the distribution of the data of the quantitative variables with Kolmogorov-Smirnov, used Kruskall Wallis, T for independent groups or U of Mann Whitney, X2 of Pearson, multiple logistic regression, and the best point of comparison was calculated. INL cutoff according to glycemic control by HbA1c using the ROC curve, sensitivity, and specificity were estimated using the statistical program SPSS version 24.
Results
369 patients were included, 231 women (62.6%). 50.4% (186) of patients concomitantly had SAH, 23% (85) had a history of smoking, 28.7% (106) had exposure to wood smoke, and 87.5% (323) of the patients did not report complications related to DM2 (Table 1).
Table 1: General Data
|
|
n |
% |
|
|
Gender |
Male |
138 |
37.4 |
|
Female |
231 |
62.6 |
|
|
Year old |
10.6 ± 9.1 IC 95% 59.6 - 62.8* |
||
|
Body Mass Index Kg/m2 |
29.4 ± 4.9 IC 95% 29 - 30.3* |
||
|
Diagnosis time (years) |
10.6 ± 9.1 IC 95% 9 – 11.3* |
||
|
Complications |
Yeah |
232 |
87.5 |
|
No |
46 |
12.5 |
|
|
Comorbidities |
None |
202 |
54.7 |
|
Systemic arterial Hypertension |
186 |
50.4 |
|
|
Dyslipidemia |
90 |
24.4 |
|
|
Heart disease |
2 |
0.5 |
|
|
Others |
75 |
20.3 |
|
|
Type of treatment |
None |
13 |
3.5 |
|
Metformin |
127 |
34.4 |
|
|
Glibenclamide |
9 |
2.4 |
|
|
Metformin and Glibenclamide |
66 |
17.9 |
|
|
Insulin |
46 |
12.5 |
|
|
Insulin and hipoglicemic |
78 |
21.1 |
|
|
Others |
30 |
8.1 |
|
|
INL |
≤1.65 |
175 |
47.4 |
|
≥1.66 |
194 |
52.6 |
|
|
HbA1c |
Glycemic control ≤ 7.1% |
144 |
39 |
|
Without glycemic control ≥7.1% |
225 |
61 |
|
|
Biomass background |
Smoking history |
85 |
23 |
|
Contact Wood smoke |
106 |
28.7 |
|
|
n: Frecuency, % percentage, *mean ± desviation standard and 95% confidence interval (IC 95%) Survey Source |
|||
After taking blood pressure, pulse pressure was calculated in mmHg, being 49.3 ± 14, IQR 18, 95% CI 47.7 – 50.8; glucose levels were 161.4 ± 64.8 mg/dl IQR 82 95% CI 154.2 - 172.0 classifying 39% as controlled. The HbA1c percentage was 8.3 ± 2.3, IQR 3.5, and 95% CI 8.2 - 8.8, classifying 50.4% as controlled.
The INL was found at 1.77 ± 0.87 IQR 0.79, 95% CI 1.65 - 1.89; serum creatinine levels 0.82 ± 0.22 mg/dl, IQR .3, 95% CI 0.78 - 0.83; triglycerides 221.6 ± 137 mg/dl IQR 121 95% CI 203.5 - 239.8 and cholesterol 194.6 ± 42.1 mg/dl, IQR 59 and 95% CI 190.4 - 201.6. When comparing the HbA1c levels with the study variables, a statistical difference was observed between the time of diabetes (greater than 10 years), the use of insulin, and higher glucose levels (Table 2).
Table 2: Comparison of the percentage of HbA1c and study variables
|
Independent variable |
N |
Mean |
SD |
IC 95 % |
P* |
||
|
Lower |
Upper |
||||||
|
Gender |
Male |
138 |
8.3 |
2.1 |
8 |
8.7 |
0.297 |
|
Female |
231 |
8.2 |
2.4 |
7.9 |
8.6 |
||
|
HAS |
No |
183 |
8.5 |
2.4 |
8.1 |
8.8 |
0.234 |
|
|
Yeah |
186 |
8.1 |
2.2 |
7.8 |
8.4 |
|
|
BMI |
No |
63 |
8.6 |
2.7 |
7.9 |
9.3 |
0.450 |
|
> 25 m2sc |
Si |
306 |
8.2 |
2.2 |
8.0 |
8.5 |
|
|
DM2 evolution |
Yeah |
227 |
7.8 |
2.3 |
7.5 |
8.1 |
0.000 |
|
> 10 years |
Yeah |
142 |
9.0 |
2.2 |
8.6 |
9.4 |
|
|
Glucose > 130 mg/dl |
No |
146 |
6.9 |
1.7 |
6.6 |
7.2 |
0.000 |
|
Yeah |
223 |
9.2 |
2.2 |
8.9 |
9.5 |
||
|
Cholesterol |
No |
200 |
7.9 |
2.2 |
7.6 |
8.3 |
0.059 |
|
>200mg/dl |
Yeah |
156 |
8.6 |
2.4 |
8.2 |
9 |
|
|
Insulin Use |
No |
245 |
7.6 |
2.1 |
7.3 |
7.9 |
0.000 |
|
Yeah |
124 |
9.6 |
2.1 |
9.3 |
10.0 |
||
|
INL >1.65 |
No |
194 |
8.1 |
2.4 |
7.8 |
8.5 |
0.058 |
|
Yeah |
175 |
8.6 |
2.2 |
8.1 |
8.8 |
||
|
Triglycerides > 150 ml/dl |
No |
107 |
7.7 |
1.9 |
7.3 |
8.1 |
0.055 |
|
Yeah |
251 |
8.5 |
2.4 |
8.2 |
8.8 |
||
|
p* U Mann Whitney, HAS: Systemic arterial hypertension, BMI: Body mass indexl. DM2 Diabetes mellitus 2, INL Lymphocyte neutrophil index |
|||||||
t was calculated for a mean, taking INL 1.65 as a reference in healthy subjects and a standard of 1.7 in our study with a statistical difference (p = 0.0012). The INL level was compared between the different age groups; it was higher in the group of > 80 years; however, the comparison of age groups did not reach statistical difference using the Kruskall-Wallis test (p=0.389). The different demographic and possible risk factors were also compared INL, without getting statistical significance in their differences.
In the bivariate analysis, associated with risk for glycemic imbalance (using HbA1c as an indicator) showed statistical significance for elevated mean arterial pressure (MAT), INL >1.65, glucose >130mg/dl, diabetes evolution >10 years, triglycerides >150mg/dl and cholesterol >200 mg/dl (Table 3).
Table 3: Lymphocyte neutrophil index and metabolic control variables
|
Independent Variables |
INL |
X2 |
||
|
≤1.65 |
≥1.66 |
p |
||
|
HAS |
No |
94 |
89 |
0.572 |
|
Si |
101 |
85 |
||
|
TAM >100 mm/hg |
Si |
142 |
121 |
0.487 |
|
No |
53 |
53 |
||
|
DM2 Time >10 years |
No |
128 |
99 |
0.085 |
|
Si |
67 |
75 |
||
|
Glucose >130 mg/dl |
Si |
80 |
66 |
0.544 |
|
No |
115 |
108 |
||
|
HbA1c >7.0 % |
No |
89 |
55 |
0.006 |
|
Si |
106 |
119 |
||
|
Triglycerides >150 mg/dl |
No |
51 |
56 |
0.122 |
|
Si |
142 |
109 |
||
|
Cholesterol >200 mg/dl |
No |
99 |
101 |
0.057 |
|
Si |
93 |
63 |
||
|
Insulin use |
No |
137 |
108 |
0.096 |
|
Si |
58 |
66 |
||
|
TAM: media arterial pressure .HAS: Systemic arterial hypertension, X2 de Pearson |
||||
While associated with higher INL levels, the bivariate analysis showed statistical significance for HbA1c > 7% and cholesterol >200 mg/dl p< 0.005.
The risk factors associated with glycemic lack of control through HbA1c were high INL, time of diabetes > 10 years, use of insulin and glucose > 130mg/dl (Table 4).
The best INL cutoff point of 1.65 was calculated, taking as reference patients without glycemic control with HbA1C > 7% using the ROC curve, showing sensitivity of 0.538 and specificity of 0.594 (Figure 1).
Table 4: Risk factors associed with glycemic lack of control HBA1C >7.1
|
Variables |
B |
Standard error |
p |
OR |
95% C.I. para EXP(B) |
|
|
Lower |
Upper |
|||||
|
DM2 > 10 years |
1.056 |
0.316 |
0.001 |
2.875 |
1.548 |
5.338 |
|
Comorbidities |
0.258 |
0.297 |
0.385 |
1.294 |
0.723 |
2.316 |
|
Use insulin |
2.088 |
0.375 |
0.000 |
8.069 |
3.866 |
16.842 |
|
BMI > 25 kg/m2 |
-0.057 |
0.385 |
0.882 |
0.944 |
0.444 |
2.011 |
|
INL >1.65 |
0.689 |
0.311 |
0.027 |
1.991 |
1.082 |
3.666 |
|
Glucose > 130 mg/dl |
2.399 |
0.311 |
0.000 |
11.008 |
5.983 |
20.253 |
|
Cholesterol >200 mg/dl |
0.345 |
0.295 |
0.241 |
1.413 |
0.793 |
2.517 |
|
BMI: Body Mass Index Índice de masa corporal ,INL: Lymphocyte Neutrophil Index DM2: Diabetes Mellitus 2 |
||||||
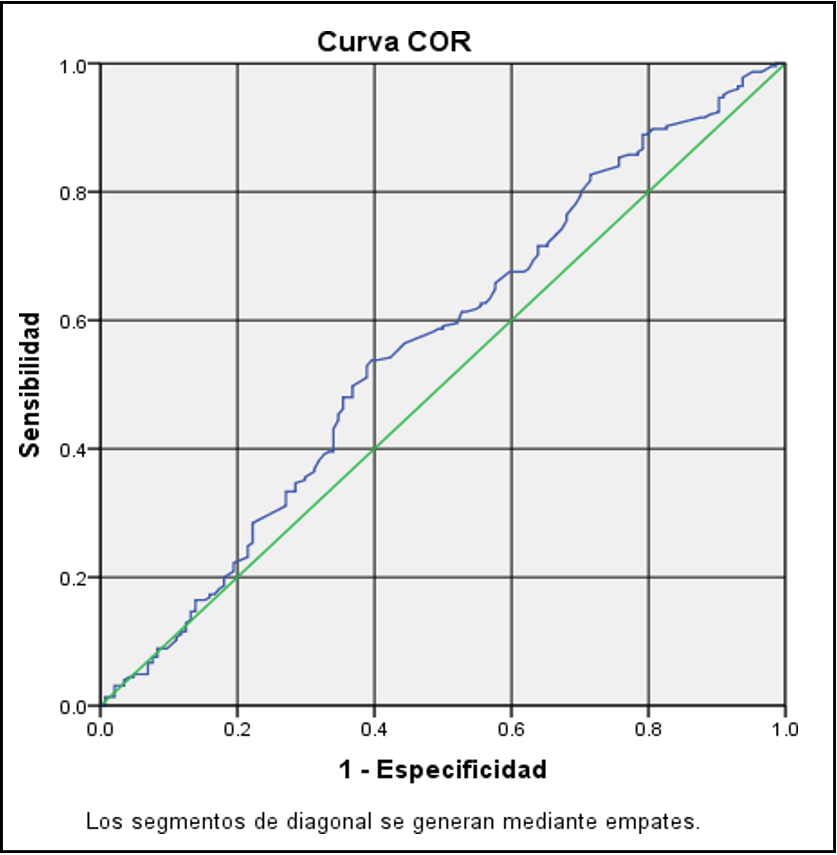
Figure 1: Curva COR
Discussion
Patients with DM2 may present subclinical systemic inflammation with increased acute phase proteins, cytokines, and mediators associated with endothelial inflammation, detecting higher levels of CRP and IL-6 than healthy subjects. It has been proposed that TNFα and IL-6 may directly interfere with insulin signaling [13].
INL has been proposed as an inflammatory marker for predicting chronic complications in patients with DM2 with lower extremity arterial disease (LEAD). Liu et al. found higher levels and a positive correlation between INL and platelet/lymphocyte index (PLI). For EAEI in diabetics [25]. In our study, elevated INL was associated with glycemic lack of control assessed with HbA1c; patients with this type of complication were omitted.
Dumman et al. found higher INL levels in patients with DM2 vs. healthy controls (2.4 vs. 1.5, p < 0.001). In the stratified analysis, the patients with DM2 and proteinuria presented higher INL than those without proteinuria. The INL showed a positive correlation with glucose and HbA1c; however, the sample size was small [23]. Mazhar Hussian et al. reported a positive correlation between glycemic control and INL. In patients with glycemic control, the NI was 2 ± 0.5 vs 4.3 ± 2.8 without authority (through HbA1c < 7% vs > 9%) [26]. In the present study, the INL was 1.75 ± 0.79, lower than reported, probably because patients with nephropathy and creatinine levels ≥1.6 mg/dl were excluded, suggesting preserved renal function; however, a general urine test was not requested. To assess for the presence of proteinuria.
Fawwad et al. [21] investigated the INL as a marker of microvascular complications in patients with DM2, reporting a significant difference between the groups with and without complications, in contrast to what was observed in our study, where patients were stratified with and without glycemic control by HbA1c without finding a statistical difference, probably because the patients did not have complications of the disease.
Palella et al. [23] analyzed whether inadequate glycemic control affects parameters of hemostasis, inflammation, and adhesion molecules. They showed that patients with DM2 and poor glycemic control (HbA1c ≥ 7%) correlate with increased prothrombin time (PT) activity (p = 0.015), higher levels of E-selectin (p = 0.009), P - P-selectin (p = 0.012) and INL (p = 0.019). In our study, the INL level did not reach a significant difference according to glycemic control by HbA1c; however, in the logistic regression model, patients with INL >1.65 had 1.9 times the possibility of presenting glycemic uncontrol. In the ROC curve, we found INL 1.64 as the best cutoff point, similar to other studies (1.65), although with low sensitivity and diagnostic specificity in this group of patients.
High, fluctuating, or persistent glucose levels can induce oxidative stress, overproduction of reactive oxygen species, endothelial dysfunction, and contribute to microvascular injury (nephropathy, retinopathy, and neuropathy) in DM2 patients. Chiu WC et al. evaluated the variability of HbA1c and progression to macroalbuminuria. They reported that the greater the variability of HbA1c, the patients with microalbuminuria had a risk of evolving to macroalbuminuria after six years of follow-up, suggesting that the variability of HbA1c induces oxidative stress and the generation of reactive oxygen species and chronic inflammation [28]. In our study, the mean HbA1c was 8.3% ± 2.3, and 61% did not achieve glycemic control according to the CPG (HbA1c > 7%) with a higher risk of developing microvascular complications in the medium term.
Patients with chronic kidney disease (CKD) on hemodialysis replacement therapy, with and without vitamin D (25-OH-D) deficiency. Patients with 25-OHD-D deficiency presented higher levels of INL 3.3 vs. 2.0 without deficiency (p = 0.039); 42.5% of the sample had a history of diabetes [29]. INL ≥ 3.5 has been considered a mortality marker in CKD patients (30). In our study, INL 1.7 was obtained; the sample did not include patients with this type of complication.
The INL is a biomarker of inflammation of non-infectious origin. An INL scale has been proposed as follows: severe value (0.1-07), normal healthy subjects [1-2], gray area with mild inflammation (2-3), mild to moderate inflammation (3-7), moderate inflammation and stress [7- 11], severe inflammation and stress [11-17] and critical [17-23] [31].
Conclusion
In our study, DM2 patients without complications had a mean INL of 1.7. The associated risk factors for presenting glycemic lack of control were higher glucose levels, INL >1.6, insulin use, and more than 10 years of diabetes.
The INL is an accessible, inexpensive biomarker that can be useful in the follow-up and control of patients with DM2. Patients with poor glycemic control could present a subclinical inflammatory state and a higher risk of micro and macrovascular complications. It is necessary to continue with the line of research and include patients with different degrees of difficulty to know the behavior of the INL and establish cutoff points in the follow-up of patients with DM2.
References
- Soto Estrada G, Moreno-Altamirano L, Pahua-Díaz D (2016) Panorama epidemiológico de México, principales causas de morbilidad y mortalidad. Rev Fac Med UNAM. 59: 8-22.
- Basto-Abreu A, López-Olmedo N, Rojas-Martínez R, Aguilar- Salinas CA, Moreno-Banda GL, et al. (2023) Prevalencia de prediabetes y diabetes en México: Ensanut 2022. Salud Publica Mex. 65: s163-s168.
- Encuesta nacional de salud y nutrición 2018-19. Resultados nacionales. ENSANUT 2018. Instituto Nacional de Salud Pública.
- Meza R, Barrientos-Gutierrez T, Rojas-Martinez R, Reynoso- Noverón N, Palacio-Mejia LS, et al. (2012) Burden of Type 2 Diabetes in Mexico: Past, Current and Future Prevalence and Incidence rates. Prev Med. 81: 445-50.
- Hernández-Ávila M, Gutiérrez JP, Reynoso-Noverón N (2013) Diabetes mellitus en México. El estado de la epidemia. Salud Publica Mex. 55(suppl 2): S129-S136.
- Rosas-Saucedo J, Caballero AE, Brito-Córdova G, García-Bruce H, Costa-Gil JE, et al. (2017) Consenso de Prediabetes.Documento de Posición de la Asociación Latinoamericana de Diabetes. Documentos de posición y consenso, ALAD. 7: 184- 202.
- Estrategia Nacional para la Prevención y el Control del Sobrepeso la Obesidad y la Diabetes. 2013. Primera edición, Secretaría de Salud. 2013
- Scully T (2012) Diabetes in numbers. Nature. 485(7398): S2-S3.
- Villarreal-Ríos E, Salinas-Martínez AM, Medina-Jáuregui A, Garza-Elizondo ME, Núñez-Rocha G, et al. (2000) The Cost of Diabetes Mellitus and Its Impact on Health Spending in Mexico. Arch Med Res. 31(5): 511-4.
- Kahn SE, Cooper ME, Del Prato S (2014) Pathophysiology, and treatment of type 2 diabetes: perspectives on the past, present, and future. Lancet. 383(9922): 1068–83.
- Javeed N, Matveyenko AV (2018) Circadian Etiology of Type 2 Diabetes Mellitus. Physiology (Bethesda). 33(2): 138-150.
- Galicia-Garcia U, Benito-Vicente A, Jebari S, Larrea-Sebal A, Siddiqi H, et al. (2020) Pathophysiology of Type 2 Diabetes Mellitus. Int J Mol Sci. 21(17): 6275.
- Reilly SM, Saltiel AR (2017) Adapting to obesity with adipose tissue inflammation Nat Rev Endocrinol. 13(11): 633-643.
- Kolb H, Mandrup-Poulsen T (2005) An immune origin of type 2 diabetes. Diabetologia. 48(6): 1038 –1050.
- Kristiansen OP, Mandrup-Poulsen T (2005) Interleukin-6 and Diabetes The Good, the Bad, or the Indifferent? Diabetes. 54(suppl 2): S114-S124.
- Grossmann V, Schmitt VH, Zeller T, Panova-Noeva M, Schulz A, et al. (2015) Profile of the Immune and Inflammatory Response in Individuals with Prediabetes and Type 2 Diabetes. Diabetes Care. 38(7): 1356-64.
- Spranger J, Kroke A, Möhlig M, Hoffmann K, Bergmann MM, et al. (2003) Inflammatory cytokines and the risk to develop type 2 diabetes: results of the prospective population-based European Prospective Investigation into Cancer and Nutrition (EPIC)- Potsdam Study. Diabetes. 52(3): 812–817.
- Turkmen K, Guney I, Yerlikaya FH, Tonbul HZ (2012) The relationship between neutrophil-to-lymphocyte ratio and inflammation in end-stage renal disease patients. Ren Fail. 34(2): 155-9.
- Karakaya S, Altay M, Kaplan Efe F, Karadağ İ, Ünsal O, et al. (2019) The neutrophil-lymphocyte ratio and its relationship with insulin resistance in obesity. Turk J Med Sci. 49(1): 245-248.
- Forget P, Khalifa C, Defour JP, Latinne D, Van Pel MC, et al. (2017) What is the normal value of the neutrophil-to- lymphocyte ratio? BMC Res Notes. 10(1): 12.
- Azab B, Camacho-Rivera M, Taioli E (2014) Average values and racial differences of neutrophil lymphocyte ratio among a nationally representative sample of United States subjects. PLoS One. 9(11): e112361.
- Chittawar S, Dutta D, Qureshi Z, Surana V, Khandare S, et al. (2017) Neutrophil-lymphocyte Ratio is a Novel Reliable Predictor of Nephropathy, Retinopathy, and coronary artery disease in Indians with Type-2 Diabetes. Indian J Endocrinol Metab. 21(6): 864-870.
- Fawwad A, Butt AM, Siddiqui IA, Khalid M, Sabir R, et al. (2018) Neutrophil-to-lymphocyte ratio and microvascular complications in subjects with type 2 diabetes: Pakistan’s perspective. Turk J Med Sci. 48(1): 157-161.
- Duman TT, Aktas G, Atak BM, Kocak MZ, Erkus E, et al. (2019) Neutrophil to lymphocyte ratio as an indicative of diabetic control level in type 2 diabetes mellitus. Afr Health Sci. 19(1): 1602- 1606.
- Guías de Práctica Clínica. Diagnóstico y Tratamiento Farmacológico de la Diabetes Mellitus Tipo 2 en el Primer Nivel de Atención 2018.
- Liu N, Sheng J, Pan T, Wang Y (2019) Neutrophil to Lymphocyte Ratio and Platelet to Lymphocyte Ratio are Associated with Lower Extremity Vascular Lesions in Chinese Patients with Type 2 Diabetes. Clin Lab. 65(3).
- Hussain M, Babar MZM, Akhtar L, Hussain MS (2017) Neutrophil lymphocyte ratio (NLR): A well assessment tool of glycemic control in type 2 diabetic patients. Pak J Med Sci. 33(6): 1366-1370.
- Palella E, Cimino R, Pullano SA, Fiorillo AS, Gulletta E, et al. (2020) Laboratory Parameters of Hemostasis, Adhesion Molecules, and Inflammation in Type 2 Diabetes Mellitus: Correlation with Glycemic Control. Int J Environ Res Public Health. 17(1): 300.
- Chiu WC, Lai YR, Cheng BC, Huang CC, Chen JF, et al. (2020) HbA1C Variability Is Strongly Associated with Development of Macroalbuminuria in Normal or Microalbuminuria in Patients with Type 2 Diabetes Mellitus: A Six-Year Follow-Up Study. Biomed Res Int. 2020: 7462158.
- Villafuerte-Ledesma HM, Moragrega B, Castillón E, Luzón- Alonso M, García-Mena M (2020) Association between vitamin D serum levels and inflammatory markers in patients on hemodialysis. Gac Med Mex. 156(6): 509-515.
- Valga F, Monzón T, Henriquez F, Antón-Pérez G (2019) Neutrophil-to-lymphocyte and platelet-to-lymphocyte ratios as biological markers of interest in kidney disease. Nefrologia (Engl Ed). 39(3): 243-249.
- Zahorec R (2021) Neutrophil-to-lymphocyte ratio, past, present and future perspectives. Bratisl Lek Listy. 122(7): 474-488.