


Bonsa Girma Fufa1*, Galana Mamo Ayana2
1Department of statistics, Collage of Natural and Computational Sciences, Diredawa University, Diredawa, Ethiopia
2Department of Epidemiology and Biostatistics, School of Public Health, Haramaya University, Harar, Ethiopia
*Corresponding Author: Bonsa Girma Fufa, Department of statistics, Collage of Natural and Computational Sciences, Diredawa University, Diredawa, Ethiopia.
Abstract
Background: Diabetes mellitus is a chronic, progressive disease characterized by elevated blood glucose levels. There are three significant categories of diabetes based on etiology and cause of disease: type 1 diabetes (TIDM), type 2 diabetes(T2DM), and gestational diabetes. The primary purpose of this study was to assess the predictors of longitudinal fasting blood sugar and survival time-to-first recovery of adult diabetic patients in Jimma Hospital.
Methods: The retrospective data from all the admitted follow-up diabetic patients who have followed at least two visits from September 1, 2018, to August 30, 2020, in Jimma Hospital is used in this study. The study follows three stages, first fitting separate survival diabetic and longitudinal models, and the Joint Model is provided next.
Result: The mean baseline age of adult diabetic patients was 45.32 years. Out of 315 adult patients 111(35.2%) were females and 204(64.8% males) from 111 females and 204 males 88(79.3%) and 156(76.5%) were recovered from female and male respectively. Generally, 244(77.5%) adult diabetic patients recovered. The result from the joint model showed that longitudinal FBS is significantly associated with survival time. The estimated association parameters (α0= -0.089, α1 = -0.198) indicate that both outcome is negatively associated, and lower values of the FBS are associated with better survival time to recovery.
Conclusion: The results of both separate and joint models were consistent. This study revealed that education level, DBP, BMI, type of Diet, type of medication, frequency of meals, and age significantly affected the change in FBS. Furthermore, the presence of hypertension, type of medication, type of Diet, frequency of meals, educational level, BMI, comorbid condition, DBP, gender, and age were significant predictors of time to recovery of adult diabetic patients. Based on the findings of this study, maintaining a healthy body weight by eating a healthy diet along with a lower blood glucose level is essential to control blood sugar in the body and prevent long-term complications.
Keywords: DM, FBS, Longitudinal sub-model, Survival sub-model, Time-to-recovery, Joint model.
Introduction
Background
Diabetes mellitus is a severe and chronic disease that occurs either when the pancreas does not produce enough insulin (a hormone that regulates blood glucose) or when the body cannot effectively use the insulin it produces. DM is a chronic, progressive disease characterized by elevated levels of blood glucose [1]. Diabetes can lead to severe damage in many parts of the body, such as the heart, blood vessels, eyes, kidneys, and nerves, and can increase the overall risk of dying prematurely, but steps to control the disease and lower the risk of complications do exist. There are three significant categories of diabetes based on etiology and cause of disease, namely type 1 diabetes (TIDM), type 2 diabetes(T2DM), and gestational diabetes [2].
In 2019, one in two (50.1%), or 231.9 million of the 463 million adults living with diabetes (overwhelmingly type 2 diabetes, aged 20–79 years) are unaware that they have the condition. It is estimated that 79.4% live in low- and middle-income countries, most of whom are between 40 and 59 years of age [3]. Based on the 2019 estimates, by 2030 a projected 578.4 million, and by 2045, projected 700.2 million adults aged 20–79 will be living with diabetes.
According to a recent report on diabetes in Africa, an estimated 19.4 million adults aged 20-79 years were living with diabetes, representing a regional prevalence of 3.9%. In Africa, 45.9% of people with diabetes live in low-income countries and 54.1% in middle-income countries. The highest prevalence (8.8%) of diabetes in the Region is among adults aged between 65 and 69 years, and more than half (59.7%) of people living with diabetes are unaware of their condition [3].
In Ethiopia, the prevalence of diabetes is expected to be 5.1% in 2035 from 4.4% in 2013 [4]. According to the International Diabetes Federation Atlas (IDFA), in 2013, there were 1.9 million diabetes cases of 20–79-year-old people and 34,262 diabetes-related deaths, and 1.2 million of them were diabetic patients from rural areas. A few studies in Ethiopia report the prevalence of diabetes mellitus in a range from 0.5% to 6.5% [5]. Moreover, the prevalence of undiagnosed diabetes, those who are neither aware of raised blood sugar nor taking any anti-diabetic medications, was very high in Ethiopia [6]. If diabetes is not recognized early and treated, it may pose serious health problems as it progresses to affect other organs of the body [7].
In recent years, the interest in longitudinal data analysis has proliferated through the development of new methods and the increase in computational power to aid and further develop this field of research. The primary purpose of this study was to assess the predictors of longitudinal fasting blood sugar and survival time-to- first recovery of adult diabetic patients in Jimma Hospital.
Methods
Data source and study design
In this study, data from a retrospective cohort admitted follow-up of all adult diabetic patients who have followed at least two visits from September 1, 2018, to August 30, 2020 (three years of data) in Jimma Hospital were included. The longitudinal and survival data are extracted from the patients' cards, containing epidemiological, laboratory, and clinical information of all diabetic patients under insulin treatment follow-up.
Population and sample
A total of 1567 diabetic patients are on active follow-up. The data for this study consists of 315 individuals. The medical records of the diabetic patients within the specified study period were extracted from the patient's chart.
Type I and II adult diabetic patients aged 18 years or older who are coming to attend their treatment at Jimma Hospital for their regular follow-up during study periods of September 1, 2018, to August 30, 2020, and only Patients with at least two visits of follow-up were eligible for this study.
The DM patients under 18, whose date of initiation was not recorded, those with only one fasting blood sugar measurement, and newly diagnosed patients who had recovered at the start of follow-up were excluded from the study. Gestational diabetes that occurs during pregnancy and diabetic patients' data that are available before and beyond the specified study period were not considered for the study.
Variables of the study
The outcome variables of this study were two: the longitudinal continuously measured continuous outcome variable and fasting blood sugar level measured in milligrams per deciliter. The survival outcome variable was the survival time (time-to-first recovery) of diabetic patients until they reached regular fasting (before meal) blood sugar levels in the follow-up period. Time to first recovery means the time until patients come to the average fasting blood sugar level for the first time in the follow-up period according to the WHO scale (70-130mg/dl). Right, censoring is considered when the patient has not recovered once between the study time, is transferred to another hospital, and dies before the first recovery to average blood sugar level.
The predictor variables were Gender, Type of medication, educational level, Comorbidity, Type of DM, Frequency of meals/ per day, Family history, Marital status, HTN, Alcohol, Diet, Place of residence, Age, SBP, DBP, and BMI.
Ethics approval and consent to participate.
The data for the analysis was obtained from Jimma Hospital, and ethical clearance for the study was provided by the research ethics review board of Jimma University. An official letter of cooperation was written to concerned bodies by the Department of Statistics. Qualified data collectors were carefully recruited and trained before the start of the data collection phase. As the study was conducted through a review of medical records, personal information regarding the study subject was replaced, and patient evidence was kept confidential without disclosing it to others. The recorded data is kept confidential and not accessed by a third person except the principal investigator.
Data collection procedures and quality control
Data for this study was secondary data routinely recorded from patients' charts in Jimma Hospital for their regular follow-up during the study periods of September 1, 2018, to August 30, 2020. Two trained professionals working in chronic follow-up clinics were recruited for data collection. The data extraction checklist was prepared and collected by Health professionals with experience in regular case follow-ups. The health management information system (HMIS) card number is used to identify individual patient cards. Then, socio-demographic and clinical factor data were collected from the date the patient-initiated follow-up treatment until the end of the study time.
The data was checked for inconsistencies, coding errors, completeness, clarity, and missing values before data entry. The data were cleaned and entered using SPSS and exported to R statistical software Version 4.0.5 for further analysis.
Data analysis
To extract information from the given data, the collected data was analyzed using different methods depending on the objective of the study to provide a certain conclusion about the collected data. The same was done in this study; descriptive and inferential data analyses were considered to analyze the collected data.
Descriptive data analysis: To describe the character of the adult diabetic patients, the collected data was analyzed using descriptive techniques that visualize the collected data using tables, graphs, and texts. The Kaplan-Meier (KM) method and profile plot were used.
Inferential data analysis: Inferential statistics was employed to infer about the population. Among the inferential techniques, different longitudinal, survival, and joint modeling approaches were considered for the study. The hazard ratio was used to measure association for the survival sub-model. The normality of the data was checked for the longitudinal outcome using a histogram and a standard quintile Q-Q plot. The generalized linear mixed effect model and the Cox proportional hazard model were fitted for the longitudinal and the survival sub-model, respectively.
Joint analysis is an elegant approach to modeling the association between time-dependent covariates and the event of interest when the covariate trajectory is not entirely observed and is subject to measurement error and biological variation. When the primary interest is in the association between such endogenous time- dependent covariates and survival, an alternative modeling framework, known as the joint modeling framework for longitudinal and time-to-event data [8], has been introduced in the literature. The design followed by package JMbayes requires first separately fitting a generalized linear mixed model for the longitudinal part and a Cox- PH model for the survival part.
Results
Descriptive Analysis
The data consists of 315 adult diabetic patients aged equal to or above 18 years old and placed under treatments that have followed between September 1, 2018, and August 30, 2020, in Jimma Hospital. Descriptive statistics of baseline covariates for adult diabetic patients were illustrated in (Table 4.1).
Among the 315 patients eligible for the study, 204 (64.8%) were males, and the remaining 111(35.2%) were females. We observed 244 (77.5%) recovery and 71(22.5%) censored observations. A large proportion of these patients, 250 (79.4%) were non-alcoholic users, while 65(20.6%) were alcohol users. Looking at the educational level of patients, 125 (39.7%) had attended secondary school. Most of the patients, 170(54.0%), were from urban residences. Most subjects were exposed to type II diabetes, and 232 (73.7%) subjects were included in the study. Regarding the family history of DM, 214(67.9%) had not, whereas 101 (32.1%) had a family history of diabetes. Of the total patients, the majority of patients, 223 (70.8%), had no history of hypertension, while 92 (29.2%) had. In addition, 134 (42.5%) patients were insulin users, 70 (22.2%) were OHA, and 111 (35.3%) patients used a combination of the two drugs. Regarding dietary type, 169 (53.7%) were patients who frequently used fruit and vegetables, 106(33.6%) were meat eaters, and the rest were patients from other types of Diets. Considering comorbidity of another disease, 202 (64.1%) patients had no comorbidity at their baseline, and the rest, 113 (35.9%), had co-infected by another disease at their baseline. Among study participants, 50 (15.9%) were those who ate less than three/per day,92(29.2%) was consuming 4-to 6 meals/per day, and most of them, 173 (54.9%), were still just eating three meals per day. Similarly, among a total number of patients, 177 (55.8%) were married, 65(19.2%) were single, 43 (15%) were divorced, and the rest of the patients were windowed.
Table 4.1: Frequencies and percentages of categorical covariates of DM patients who were enrolled in Jimma Hospital.
Status of DM patients
|
Variables Name |
Categories |
Censored(%) |
Recovered(%) |
Number(%) |
|
Gender |
Male |
48(23.5%) |
156(76.5%) |
204(64.8%) |
|
Female |
23(20.7%) |
88(79.3%) |
111(35.2%) |
|
|
Residence |
Rural |
34(23.5%) |
111(76.5%) |
145(46.0%) |
|
Urban |
37(21.8%) |
133(78.2%) |
170(54.0%) |
|
|
Educ Status |
No formal |
12(33.3%) |
24(66.6%) |
36(11.4%) |
|
Primary |
24(28.6%) |
60(71.4%) |
84(26.7%) |
|
|
Secondary |
24(19.2%) |
101(80.2%) |
125(39.7%) |
|
|
Tertiary |
16(22.9%) |
54(77.1%) |
70(22.2%) |
|
|
Co-morbid |
Absent |
58(28.7%) |
144(71.3%) |
202(64.1%) |
|
Present |
58(51.3%) |
55(48.7%) |
113(35.9%) |
|
|
Type of medication |
Insulin |
41(30.6%) |
93(69.4%) |
134(42.5%) |
|
OHA |
20(28.6%) |
50(71.4%) |
70(22.3%) |
|
|
Both |
20(18.0%) |
91(82%) |
111(35.2%) |
|
|
HTN |
No |
50(22.4%) |
173(77.6%) |
223(70..8%) |
|
Yes |
37(40.2%) |
55(59.8%) |
92(29.2) |
|
|
Type ofDM |
Type I |
21(25.3%) |
62(74.7%) |
83(26.3%) |
|
Type II |
50(21.6%) |
182(78.4%) |
232(73.7%) |
|
|
Freqofmeal/day |
Less than three /day |
11(22%) |
39(78%) |
50(15.9%) |
|
Three/day |
29(16.8%) |
144(83.2%) |
173(54.9%) |
|
| Four-six /day | 35(38.1%) | 57(61.9%) | 92(29.2%) | |
|
Family history of DM |
No |
33(15.4%) |
181(84.6%) |
214(67.9%) |
|
Yes |
41(40.6%) |
60(59.4%) |
101(32.1%) |
|
|
Marital status |
Single |
16(24.6%) |
49(75.4%) |
65(19.2%) |
|
Married |
48(27.1%) |
129(72.9%) |
177(55.8%) |
|
|
Divorced |
14(32.6%) |
29(67.4%) |
43 (13.7%) |
|
|
Widowed |
10(33.3%) |
20(66.7%) |
30 (9.5%) |
|
|
Alcohol |
No |
64(25.6%) |
186(74.4%) |
250(79.4%) |
|
Yes |
27(41.5%) |
38(58.5%) |
65(20.6%) |
|
|
Type of diet |
Fruit and vegetable |
38(22.5%) |
131(77.5) |
169(53.7%) |
|
Meat |
44(41.5%) |
62(58.5%) |
106(33.6%) |
|
|
Others |
15(37.5%) |
25(62.5%) |
40(12.7%) |
Separate Analysis of the Longitudinal Data
Exploring Individual Profiles and Mean Structure
(Figure 4.1) is an individual profile plot of longitudinal fasting blood sugar of adult diabetic patients by follow-up time. As indicated on the plots, the personal profile plots suggested that there were within and between variations of change in FBS measurements over time. The particular trajectory of FBS for patients shows that patients had considerably different FBS at baseline and over time. This suggests that a random intercept and slope model is a good start. However, the red line, which shows the mean structure of FBS measurement over time with the loess smoothing technique, suggested the linear change of the mean of FBS measurement over time.
To understand the possible relationships among the FBS means over time, a plot of a line connecting the average values computed at each time point is shown below (Figure 4.2). The mean structure plot suggests that the mean of the FBS profiles has a linear relationship over time. Since the data is not balanced, the loess smoothing technique is appropriate to offer the mean structure. Also, since the locally weighted least square (loess) smoothing curve of the individual profile plot also suggests the linear effect mean structure, the linear time effects were included as random effects in the model.
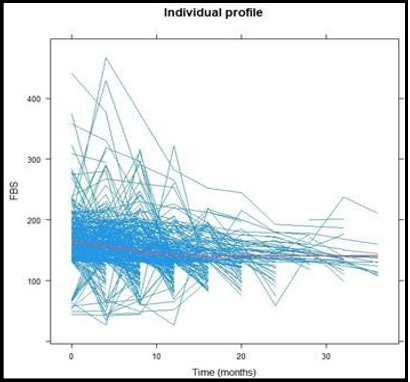
Figure 4.1: Individual profile plot and the evolution of mean structure of FBS overtime
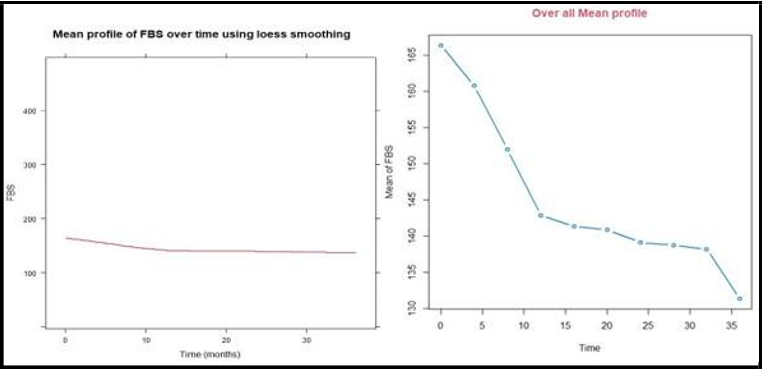
Figure 4.2: The mean of FBS measurements evolution structure over time
Linear Mixed Effect Model
In this analysis, we considered sixteen variables. Among these variables, those significant at 25% modest significance level in the univariate analysis were used as a candidate for the multivariate analysis. The result in the appendix (Table 4.2) revealed that the variables age, BMI, DBP, SBP, type of Diet, type of medication, educational level, hypertension, frequency of meals per day, and comorbid condition were found to be significant at 25% level of significance and they are considered in the multivariate analysis. However, gender, place of residence. Type of diabetes, marital status, alcohol consumption, and family history of diabetes were not significant variables for the change in fasting blood sugar. After we chose the important covariates in the uni variable linear mixed model, we incorporated them into a multivariable linear mixed model for fasting blood sugar level data and fitted them with the estimated value of significant covariates.
In Table 4.3, the computed AIC and BIC are reported. The random intercept and random slope models have lower AIC and BIC values than the random intercept and quadratic slope models. Therefore, random intercept and random slope models were used in the linear mixed effect model that appropriately predicts the mean change of the fasting blood sugar over time.
(Table 4.4) showed the result of the linear mixed effect model and found the variables age, observation time, body mass index, diastolic blood pressure, type of Diet, educational level, type of medication, frequency of meals, and time by type of Diet and comorbid interaction were significantly associated with mean change in the fasting blood sugar at 5% level of significance
Table 4.2: Summary statistic of the longitudinal PBS of adult diabetic patients at different follow up months.
|
Time |
Baseline |
4 |
8 |
12 |
16 |
20 |
24 |
28 |
32 |
36 |
|
Number(N) |
315 |
300 |
277 |
203 |
130 |
74 |
47 |
33 |
25 |
12 |
|
Mean (PBS) |
166.4 |
160.8 |
152.1 |
142.9 |
141.4 |
140.8 |
139.1 |
137.6 |
135.2 |
131.3 |
|
Std |
45.20 |
49.96 |
48.17 |
41.31 |
36.96 |
41.94 |
39.59 |
25.54 |
45.18 |
31.40 |
Table 4.3: Selection of random effect models to be included in linear mixed effect model.
|
Model |
Random effect |
AIC |
BIC |
|
1 |
Random intercept |
13773.13 |
13908.18 |
|
2 |
Random intercept and random slopes |
13745.66 |
13885.91 |
|
3 |
Random intercept and quadratic slope |
13756.46 |
13901.91 |
Table 4.4: Parameter estimate of linear mixed effect model with random intercept and random slope model.
|
Variables |
Estimate |
Std |
t-value |
p-value |
95%CI |
|
Intercept |
89.049 |
19.144 |
4.589 |
0.0000* |
[84.99,98.36] |
|
Age |
-0.013 |
0.138 |
-0.091 |
0.0344* |
[-0.09,-0.32] |
|
BMI |
0.862 |
0.382 |
2.2604 |
0.0240* |
[0.72, 2.94] |
|
SBP |
-0.027 |
0.131 |
-0.208 |
0.835 |
[-0.25,-0.02] |
|
(Type of diet)l |
0.952 |
5.324 |
0.179 |
0.0470* |
[0.45,2.949] |
|
(Type of diet)2 |
-1.408 |
5.688 |
-0.248 |
0.560 |
[-2.64,-0.98] |
|
(Eduleve)l |
-8.758 |
5.375 |
-1.629 |
0.104 |
[ -9.58,-4.04] |
|
(Edulevel)2 |
-10.131 |
4.846 |
-2.091 |
0.0368* |
[ -12.71,-6.02] |
|
(Edulevel)3 |
-11.279 |
5.624 |
-2.006 |
0.0452* |
[-14.57,-9.43] |
|
(HTN)l |
4.594 |
4.409 |
1.042 |
0.298 |
[1.84,9.29] |
|
DBP |
0.486 |
0.210 |
2.311 |
0.0215* |
[0.07,0.88] |
|
(Medication)1 |
-9.199 |
4.792 |
-1.919 |
0.0558 |
[-12.17, -3.51] |
|
(Medication)2 |
-11.410 |
4.149 |
-2.751 |
0.0061* |
[-18.51,-10.62] |
|
(Freqofmel)1 |
7.604 |
5.232 |
1.454 |
0.147 |
[4.42,9.49] |
|
(Freqofmel )2 |
24.172 |
5.624 |
4.298 |
0.0000* |
[20.28,37.21] |
|
(Comorbid) 1 |
1.7302 |
0.5627 |
3.0747 |
0.062 |
[0.63,2.83] |
|
Time |
-2.457 |
0.259 |
-9.468 |
0.0000* |
[-3.40,-2.35] |
|
BMI:Time |
0.133 |
0.271 |
0.491 |
0.6238 |
[-0.657,0.392] |
|
(Type of diet)1:Time |
1.679 |
2.112 |
0.795 |
0.0147* |
[0.728, 2.413] |
|
(Type of diet)2:Time |
-3.749 |
2.311 |
-1.623 |
0.1050 |
[-5.613, -2.728] |
|
(HTN)1:Time |
2.045 |
1.761 |
1.162 |
0.2457 |
[1.366, 5.456] |
|
(Comorbid)l:Time |
0.298 |
0.440 |
0.676 |
0.002* |
[0.165,1.05] |
|
Random effect |
|
|
|
|
|
|
Parameter |
Std |
|
|
|
|
|
Intercept |
28.1775 |
|
|
|
|
|
Time |
1.9849 |
|
|
|
|
|
Residual |
36.1268 |
|
|
|
|
Separate Survival Data Analysis
Descriptive Analysis for Survival Time
The patients were followed up for a total of 36 months. The mean survival time of adult diabetic patients aged 18 years or older based on a cohort of 315 patients was 28.3 months with median and standard deviation of 9 and 3.3 months, respectively. The graph of the Kaplan- Meier estimate of total survival functions is shown in (Figure 4.3), indicating a decreasing pattern of survivorship function as we expected. The plots (Figure 4.3) show that there are relatively similar patterns of survival, with rapidly descending estimated survival functions. The line for female, Frequency of meals(four-six/day), education level (no formal education), type of medication (OHA), kind of Diet (Meat), Hypertension (Yes), and Comorbid (Yes) lies above their respective(belonging) categories, which indicates that they are prolonged longer to recover from the disease.
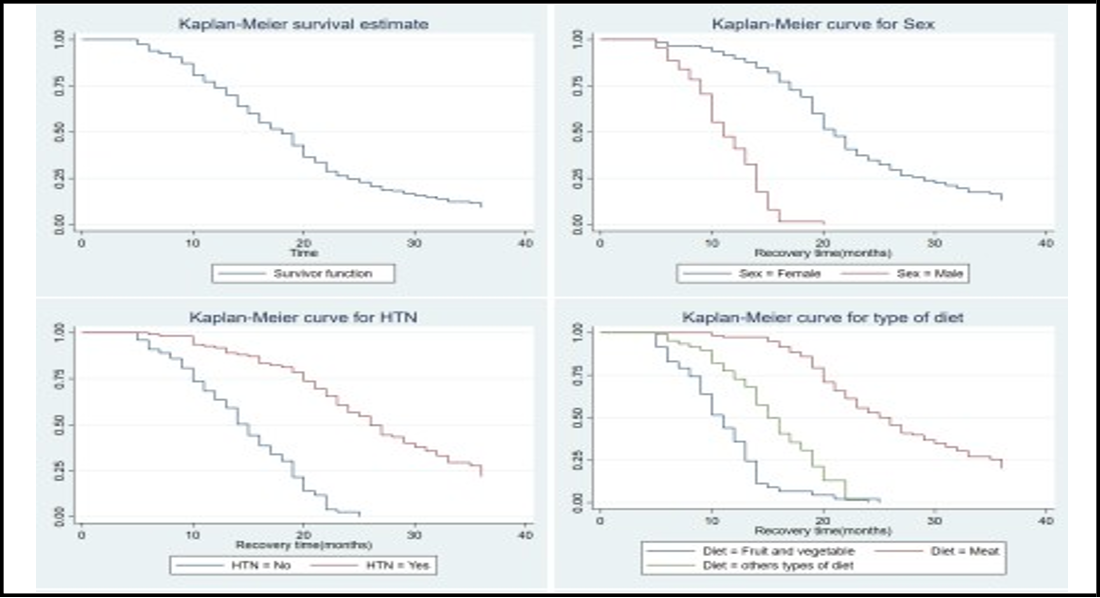
Figure 4.3: Kaplan-Meier survival plots of some selected categories of predictor variables.
Analysis of Multivariate Cox-PH Model
The result of multivariate analysis of the cox-PH model in (Table 4.5) indicates the variables gender, age, hypertension, comorbidity condition, body mass index, frequency of meals, type of Diet, type of medication, educational level, and diastolic blood pressure were significantly contributed to survival probability of DM Patients under treatment at 5% level of significance. The results reveal that after accounting for other confounders in the data, recovery takes longer with a unit increase of diastolic blood pressure and body mass index at baseline in diabetic patients. This implies that the lower the age, DBP, and BMI at baseline, the faster the rate of recovery (blood sugar level reaching the normal range) of diabetic patients.
Proportionality Hazard Assumption
Table (Table 4.6) shows a test of the proportionality assumption of the Cox proportional hazard model. P-values of the coefficient terms are not significant at a 5% significance level. This ascertains the validity of the assumption of the proportional hazards. The overall proportionality test (Global test) is also insignificant. Therefore, the proportionality assumption is not violated.
Table 4.6: Global test for proportionality assumption
|
Covariates |
rho |
Chisq |
p |
|
Age |
0.0017 |
0.0004 |
0.985 |
|
Gende1· |
0.0346 |
0.4567 |
0.499 |
|
BMI |
0.0245 |
0.1802 |
0.671 |
|
Comorbid |
0.026 |
1.4223 |
0.249 |
|
Medication |
-0.1013 |
2.5268 |
0.112 |
|
HTN |
0.0548 |
0.7265 |
0.394 |
|
Diet |
0.0059 |
0.0088 |
0.925 |
|
DBP |
-0.0231 |
0.1308 |
0.718 |
|
Edulevel |
0.0202 |
0.1043 |
0.747 |
|
Freqofmel |
0.0128 |
0.0383 |
0.845 |
|
GLOBAL |
NA |
5.844 |
0.834 |
Result based on the joint model.
After having appropriate separate models for the mean of the fasting blood sugar and time to recovery of adult diabetic patients, the next step is to explore a proper joint model that associates the longitudinally measured fasting blood sugar and time to recovery of adult diabetic patients. This study employed the collaborative modeling approach following the variable in the Cox proportional hazard model and linear mixed effect model, shown in the following. The estimate of the association parameter due to the random intercept and random linear slope of fasting blood sugar measurement (α0 = - 0.089, α1 = -0.198), which was negative, means that subject-specific baseline and linear slope of individual fasting blood sugar measurement marker was negatively associated with the hazard of recovery. The association parameter (α) was significantly different from zero (p-value< 0.05 ), indicating that there is a strong association between the fasting blood sugar and time to recovery of DM patients. The negative value of the association parameter showed that the intercept and slope of fasting blood sugar were negatively associated with the time to recovery of DM patients, and with a unit increase in the fasting blood sugar, the time to recovery was decreased. The fitted joint model is displayed in (Table 4.7)
Table 4.7: Parameter estimate of joint modeling of longitudinal and survival outcomes.
|
Longitudinal Sub-Model |
|
Survival Sub-Model |
|||||
|
Variables |
Estimate |
Std |
p-value |
Variables |
Estimate |
Std |
p-value |
|
Intercept |
89.159 |
18.2061 |
0.0000* |
Age |
-0.36 |
0.405 |
0.004* |
|
Age |
-0.0521 |
0.0778 |
0.0344* |
(Gende1·)l |
1.569 |
0.2143 |
2.21e-04 * |
|
BMI |
0.8744 |
0.3615 |
0.0240' |
BMI |
-0.0656 |
0.0156 |
0.04482 ' |
|
SBP |
-0.0472 |
0.1]03 |
0.8352 |
(Type of Diet)l |
-0.0825 |
0.] 194 |
0.0]645 ' |
|
(Type of diet)l |
1.0252 |
0.1489 |
0.0470* |
(Type of Diet)2 |
0.3121 |
2.104 |
0.0827 |
|
(Type of diet)2 |
-1.438 |
5.485 |
0.560 |
(Edulevel)1 |
-0.3503 |
0.443 |
0.1146 |
|
(Eduleve)l |
-8.8878 |
5.3001 |
0.1035 |
(Edulevel)2 |
-0.3641 |
0.3812 |
0.0432 * |
|
(Edulevel)2 |
-10.331 |
4.546 |
0.0368* |
(Edulevel)3 |
-0.4317 |
0.4577 |
0.04854* |
|
(Edulevel)3 |
-11.2193 |
5.5236 |
0.0452 ' |
(Medication) 1 |
0.1327 |
0.0734 |
0.186 |
|
(HTN)l |
4.6144 |
4.3067 |
0.2977 |
(Medication)2 |
0.234 |
0.09891 |
0.0478* |
|
DBP |
0.5959 |
0.2002 |
0.0215* |
DBP |
-0.1037 |
0.00468 |
0.03717* |
|
(Medication)1 |
-10.189 |
4.6621 |
0.0558 |
(Freqofmel)O |
0.36872 |
0.21211 |
0.0822 |
|
(Medication)2 |
-11.540 |
4.1005 |
0.0061* |
(Freqofmel)1 |
0.44341 |
0.19322 |
0.02790 : |
|
(Freqofmel) 1 |
7.844 |
4.7716 |
0.1471 |
(HTN)O |
0.96822 |
0.21528 |
0.00968 * |
|
(Freqofmel )2 |
24.255 |
5.4239 |
0.0000* |
(Cornorbid)O |
0.9812 |
0.2234 |
3.64e-03 * |
|
(Comorbid) 1 |
1.6012 |
0.4427 |
0.062 |
Association |
|
|
|
|
Time |
-2.567 |
0.1279 |
0.0000* |
ao |
-0.089 |
0.0138 |
<0.0001* |
|
BMI:Time |
0.234 |
0.254 |
0.6238 |
ai |
-0.1975 |
0.0926 |
0.033* |
|
(Type of Diet)1:Time |
1.879 |
1.854 |
0.0147* |
|
|
|
|
|
(Type of Diet)2:Time |
-3.959 |
2.011 |
0.1050 |
|
|
|
|
|
(HTN)l:Time |
2.135 |
1.663 |
0.2457 |
|
|
|
|
|
(Comorbid)1:Time |
0.321 |
0.310 |
0.002* |
|
|
|
|
|
Random effect |
|
|
|
|
|
|
|
|
Parameter |
std |
|
|
|
|
|
|
|
Intercept |
26.4995 |
|
|
|
|
|
|
|
Time |
2.3922 |
|
|
|
|
|
|
|
Residual |
34.7910 |
|
|
|
|
|
|
Model Diagnosis
This study used standardized marginal residuals plot to assess the assumption of the linear mixed effect model and Schoenfeld residual to assess the proportionality assumption of the Cox proportional hazard model. To check these model assumptions, the study used standard residual plots to validate the assumptions behind linear mixed effect and Cox proportional hazard models when they are separately fitted. To validate the Cox proportional hazards model assumption of the survival sub-model, a graph of the Schoenfeld residuals was displayed to check the overall goodness of fit for survival sub-models. (Figure 4.4) the scaled Schoenfeld residuals are randomly distributed, and a loess-smoothed curve does not exhibit many departures from the horizontal line, suggesting that the proportional hazards assumption is not violated.
The plot shows that the longitudinal sub-model (FBS) response variables are typically distributed because the points are scattered on the line. From the exact Figure, the bottom plot shows a marginal residual versus fitted values plot of the standardized residuals for longitudinal Fasting blood sugar, and the fitted LOWESS curve is close to 0. Hence, it indicates validation of the assumption of normality of the error term in the longitudinal sub-model. The Marginal survival plot and marginal cumulative hazard plot showed that the survival probability (not developing recovery) came down and the likelihood of developing recovery status came up to one, respectively, when the follow-up time was increased.
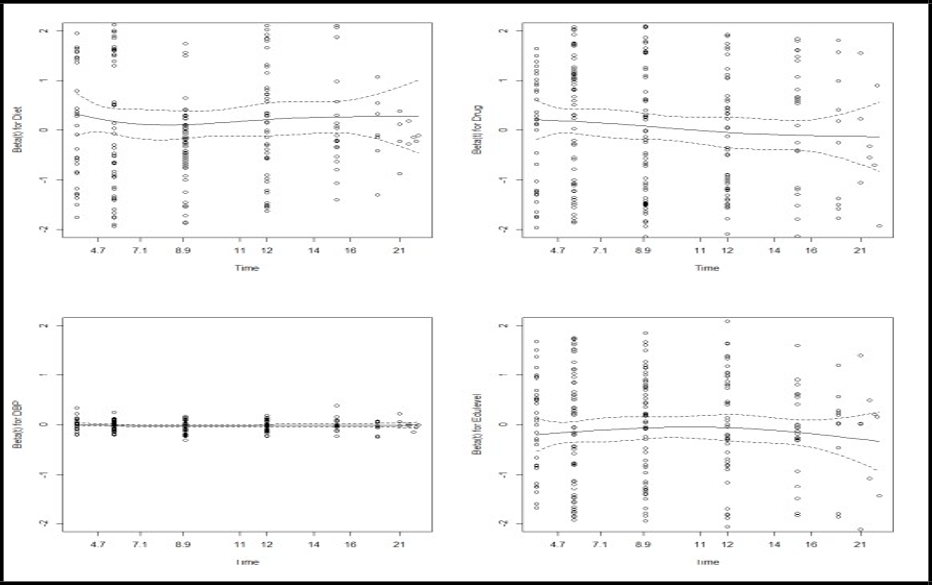
Figure 4.4: Plot of scaled Schoenfeld residual for test of proportionality assumption.
Discussion
In this study, two different analyses were explored: the longitudinal and survival data analysis for each outcome separately and the joint model analysis of both outcomes.
The study revealed that the variables age, BMI, DBP, educational level, type of medication, Diet, and frequency of meals/day were significant for both outcomes. The covariate such as gender, age, BMI, DBP, educational level, type of medication, type of Diet, hypertension, comorbidity condition, and frequency of meals/day is a predictor that determines survival time to recovery of adult DM patients. In contrast, observation time, age, BMI, DBP, type of Diet, type of medication, and education level were the predictors associated with fasting blood sugar change over time, similar to the study conducted in Gondar, Ethiopia [9]. The results of our research are also supported by a study in Ghana, which has shown that the duration of treatment (time), weight, educational level, and diastolic blood pressure significantly affect the fasting blood sugar level [10].
The study revealed that for a one-year increase in a patient's age, the expected value of FBS level reduced by 0.013 mg/dl when the effect of the other factors was kept constant. This result is in line with the findings of Adampah et al., Taylor et al., and Ikezaki et al. [10,11,12] that the fasting blood sugar levels tended to correlate negatively with age. Also, a unit increase in the BMI of a patient increases the fasting blood sugar level by 0.862 mg/dl. This positive association is similar to a study by Abdulahi et al. [9].
For the frequency of meals, this study showed that four to six meals per day increases the mean of fasting blood sugar by 24.172 compared to less than three meals per day. It indicated that the four-six-meal/day was better at controlling the blood sugar in obese patients with diabetes and improving post-meal blood glucose in pre-diabetic people, compared to the three-meal/day, which is similar to the study conducted in Greece [13].
According to the medication (insulin, OHA, or the combination of insulin and OHA) used by patients, the mean change of FBS level of the patients who used the combination of the treatment insulin and OHA lower by 11.410 as compared to the patients who used the insulin drug alone. This indicated that the combination of the two drugs is more important in reducing and controlling fasting blood sugar than insulin and OHA drugs. This study aligns with the survey of Zeru et al. and Abdulahi et al. [14, 9]. The study also found that DBP was a significant predictor of FBS level, which agrees with a study conducted in Ethiopia [9].
Considering the type of Diet, HR (0.958) indicates a 4.2% chance of the patients with meat eating recovering first as compared to the fruit and vegetable diet. Therefore, individuals who mostly eat meat have prolonged recovery compared to fruit and vegetable eaters. The study showed that to control and manage blood sugar, a Diet related to cereals, vegetables, and fruits is recommended, while other dietary types related to eggs, meat, and proteins increase blood sugar levels related to diabetes and its complications, which is in line with [15].
On the other hand, the collaborative model performed better when evaluating the overall performance of the separate and joint models in terms of model parsimony and goodness of fit. Also, the statistical significance of both the association parameters was evidence that the cooperative model was better than the separate models.
Despite the above strength, this study has limitations. Data on some significant predictors, such as economic status, physical activity, and others, were not available. Another limitation was that in our study area, HBA1C was not 65 done for follow-up, which is the recommended mode of testing blood sugar control. This study used two response variables using a joint model, but there was no related published literature on the country to compare and contrast the findings of this study obtained through the collaborative modeling frameworks in the local context.
The results of this study will be helpful for adult diabetic patients by identifying the risk factors for their survival time. It also helps the health sectors as inputs to create awareness for the community on the risks for the survival of adult diabetic patients.
Conclusion
This study revealed that being secondary and tertiary educated, diastolic blood pressure, body mass index, type of diet meat, type of medication (Insulin and OHA), frequency of meals four-six per day, age, time, and interaction of Diet and comorbid with time were found to be a significant effect for the change of fasting blood sugar. From the study's result, patients with lower body mass index, higher educational attainment, and who used a combination of insulin and OHA medication were better able to manage and control their fasting blood sugar levels in their bodies. On the other hand, the presence of hypertension, type of medication both (Insulin and OHA), kind of diet meat, frequency of meals four per day, educational level (secondary and tertiary), body mass index, other comorbid conditions, diastolic blood pressure, gender, and age were significant predictors of time to recovery of adult diabetic patients. The study showed the significance of the association parameter (-0.089, -0.198) in joint models. The estimated association parameters indicate longitudinal fasting blood sugar and the survival time to recovery were negatively associated, implying higher values of the FBS associated with a longer recovery time of diabetic patients. Therefore, due to the significance of the association between the longitudinal and survival outcomes, joint model analysis was suggested over separate model analysis.
Abbreviations
ADA: American diabetes association AIC: Akaike’s information criteria BIC: Bayesian information criteria BMI: Body mass index DBP: Diastolic Blood Pressure FBS: Fasting Blood Sugar HBA1C: Hemoglobin A1C HR: Hazard Ratio HTN: Hypertension IDFA: International diabetes federation Atlas JUMC: Jimma University Medical center JM: Joint Model KM: Kaplan-Meier LR: Likelihood Ratio LMM: Linear Mixed-Effect Model MI: Multiple Imputation MLE: Maximum Likelihood Method MNAR: Missing Not at random OAD: Oral antidiabetic drugs PH: Proportional Hazard REML: Restricted maximum likelihood SBP: Systolic Blood Pressure T2DM: Type 2 diabetes T1DM: Type 1 diabetes USA: United State of America WHO: World Health Organization
Declaration
Consent to publication: Not applicable
Competing interests: There is no competing interests related to this work.
Authors’ contributions
BGF selects the title, data curation, software, analyzed, and prepared the manuscript. GMA, involved in conceptualization, design, interpreting findings. All authors read and approved the final manuscript.
Acknowledgments
First of all, we would like to forward our kindest regards to almighty God. We are greatfull to all participants in the data collecton process. Finally, the authors would forward great thanks to the Jimma Universitry for the financial support.
References
- ORGANISATION, W. H. 2018. Global report on diabetes Geneva; swizerland
- ORGANIZATION, W. H. (2016) Global report on Diabetes In. Geneva, Swizerland: WHO.
- IDFA 2019b. International Diabetes Federation Atlas ninth edition.
- WHO 2018a. Global estimate prevalence of diabetes.
- Endriyas M, Mekonnen E, Dana T, Daka K, Misganaw T, et al. (2018) Burden of NCDs in SNNP region, Ethiopia: a retrospective study. BMC health services research. 18(1): 1-7.
- Asmelash D, Asmelash Y (2019) The burden of undiagnosed diabetes mellitus in adult African population: a systematic review and meta-analysis. Journal of diabetes research. J Diabetes Res. 2019: 4134937.
- Mohamed SF, Mwangi M, Mutua MK, Kibachio J, Hussein A, et al. (2018) Prevalence and factors associated with pre-diabetes and diabetes mellitus in Kenya: results from a national survey. BMC public health. 18(3): 1215.
- Therneau T, Lumley T (2009) survival: Survival analysis, including penalised likelihood. R package version, 2(6).
- Abdulahi AM, Aguade AE, Yohannis HK (2021) Longitudinal modeling of fasting blood sugar variation over time among adult diabetic patients in case of Adama hospital medical college.
- Adampah T, Nawumbeni DN, Nyadanu SD, Polishuk RM (2015) Mixed-Effects Model for Longitudinal Study of Type-2-Diabetes. International journal of Statistics and applications. 5(2): 47-55.
- Taylor SE, Lobel M (1989) Social comparison activity under threat: downward evaluation and upward contacts. Psych Rev. 96(4): 569-575.
- Ikezaki A, Hosoda H, Ito K, Iwama S, Miura N, et al. (2002) Fasting Plasma Ghrelin Levels Are Negatively Correlated With Insulin Resistance and PAI-1, but Not With Leptin, in Obese Children and Adolescents. Diabetes. 51(12): 3408–3411.
- Papakonstantinou E, Kontogianni MD, Mitrou P, Magriplis E, Vassiliadi D, et al. (2018) Effects of 6 vs 3 eucaloric meal patterns on glycaemic control and satiety in people with impaired glucose tolerance or overt type 2 diabetes: A randomized trial. Diabetes & metabolism. 44(3): 226-234.
- Andargie AA, Zeru MA (2018) A longitudinal data analysis on risk factors for developing type-2 diabetes mellitus at the University of Gondar Comprehensive Specialized Hospital, Gondar, Ethiopia. Journal of Public Health and Epidemiology. 10(6): 171-182.
- Panagiotakos DB, Tzima N, Pitsavos C, Chrysohoou C, Papakonstantinou E, et al. (2005) The relationship between dietary habits, blood glucose and insulin levels among people without cardiovascular disease and type 2 diabetes; the ATTICA study. The Review of Diabetic Studies. 2(4): 208-15.