


Odumeru E.A1*, Mukangendo M1, Kayitesi I1, Nyampinga B2, Niyogushimwa S3, Nshimiyimana D4, Nyirambarushimana F5, Njoku C6
1,2,3,4,5Department of Medical Imaging Sciences, School of Health Sciences, College of Medicine and Health Sciences, University of Rwanda, Remera Campus, Rwanda
6Department of Medical Laboratory Science, Imo State College of Health and Management Sciences, Amaigbo, Nigeria
*Corresponding Author: Odumeru E.A, Department of Medical Imaging Sciences, School of Health Sciences, College of Medicine and Health Sciences, University of Rwanda, Remera Campus, Rwanda.
Abstract
Thermographic imaging (TI) is the use of Infrared (IR) thermograms to study heat distributions in human structures or regions to aid in making diagnoses of health conditions such as SARS-CoV-2 disease. It is non-invasive and requires no contact tool which may aid in the prevention of the spread of coronavirus and other comorbid infectious diseases. The contactless imaging technology modality has not been given due consideration in the protocol of diagnosis of symptomatic COVID-19 disease and comorbidity conditions. The study aims to have an overview and review of thermography imaging potentials in aiding the diagnosis of symptomatic COVID-19 patients and comorbidity, highlight its symptomatic profile including fever assessment, diagnostic tools predominantly employed, Components, types of IR cameras and mode of operation of TI and specifically the diagnostic yield of body fever (temperature) assessment, skin-surface-organ heat distribution IR mapping and TI comparison with other imaging modalities. The limitations of infrared imaging technology were also identified and recommendations were proffered to improve its effectiveness in the early detection and aid in diagnosis and management of mild, moderate, and severe cases of the SARS-CoV-2 infection and Comorbidity.
Keywords: Thermography; Infrared cameras, COVID-19; SARS-CoV-2; Comorbidity
Introduction
Thermography uses thermograms to study heat distributions in human structures or regions. Is non-invasive and requires no contact tool, it uses heat from the body to aid in making a diagnosis of a health condition, is safe, and uses no radiation. [1] Medical application of thermography includes breast pathologies, diabetic conditions, extra- cranial disease, neuromusculoskeletal vertebrae disorders, arthritis, and lower extremity vascular disease, and could also be effectively used for Covid-19 disease. [2,22,23,24,25] Besides medical usage, it is also employed for automatic face recognition and fever assessment in mass screening at airports and hospitals.[3]
Conversely, thermography does not provide information on morphological characteristics. But rather it provides functional information on thermal and vascular conditions of the tissue. [2] This modality was documented in 1700 BC by Papyrus and by 400 BC, physicians commonly employed a primitive form of thermography, by the use of a thin coat of mud applied to a patient body, and patterns made by the different rates of mud drying were observed. They attributed those patterns to hot and cold temperatures on the surface of the body. Over the centuries, this primitive form of thermography was transformed to using the modern-day mercury thermometer and the use of Fahrenheit and Celsius scales to measure temperature developed.[4]
However, humans, as a natural effect of metabolism, constantly release varying levels of energy in the infrared spectrum in the form of heat. This discovery made it possible for devices to focus on measuring infrared heat from the human body [5]. Clinical diagnosis of various pathological conditions affecting the distribution of the skin surface temperature at one or more parts of the human body was considered the most important clinical aspect of thermology. [6]COVID-19 on the other hand is not an exemption in skin surface heat distribution amongst other conditions Covid 19, a novel coronavirus named Severe Acute Respiratory Syndrome Coronavirus-2 (SARS-CoV-2) due to its high homology (~80%) to SARS-CoV, which caused acute respiratory distress syndrome (ARDS) and high mortality during 2002–2003. [7] The disease caused by this virus was called Coronavirus disease 19 (COVID-19) and a pandemic was declared by the World Health Organization (WHO) in 2020. COVID-19 has impacted a large number of people worldwide, being reported in approximately 230 countries and territories. [8,9] The SARS-CoV-2 virus primarily affects the respiratory system, although other organ systems are also involved. Lower respiratory tract infection-related symptoms including fever, dry cough, and dyspnea were reported initially [10]. In addition, headache, dizziness, generalized weakness, vomiting, and diarrhea were also observed [11]. It is now widely recognized that respiratory symptoms of COVID-19 are extremely heterogeneous, ranging from minimal symptoms to significant hypoxia with ARDS. Epidemiological studies have also shown that mortalities were higher in the elderly population and the incidence was much lower in children [11].
Current medical management is largely supportive with no targeted therapy available. Several drugs including lopinavir-ritonavir, remdesivir, hydroxychloroquine, and azithromycin have been tested in clinical trials and used on patients [11,14,15,16], but none of them have been proven to be a definite therapy yet. In 2021, various vaccines have been developed these include BioNTech, Pfizer, Johnson and Johnson, Moderna, Oxford, AstraZeneca, and Sputnik V Vaccines. Large clinical trials are important ways to show the effectiveness of the vaccine, the vaccines are said to reduce mild, moderate, and severe cases of Covid-19. [17]Meanwhile, WHO still warns that after vaccination of two doses and a booster, it is possible to still spread the infection to others without getting the disease, so advised the continuous wearing of face masks, washing of hands, and safe distance keeping [17].
The diagnosis of Covid-19 has improved since the disease outbreak in 2019. Laboratory and imaging investigations such as chest X-rays, chest CT, and Lung ultrasound have been employed and improved upon [18]. On the other hand, thermography, a medical imaging modality, non-invasive, non-contact tool modality has not been given due consideration in the protocol of diagnosis of symptomatic Covid- 19 disease. There is a scarcity of published research on the potential role of thermal imaging in the remote detection of respiratory issues due to coronavirus disease-19 (COVID-19). [43]
The aim of this study is to have an overview and review of thermography imaging modality to aid in the diagnosis of symptomatic Covid-19 patients and comorbidities.
Symptomatic Covid-19 profile
Coronavirus infection is transmitted through droplets or aerosol generated by symptomatic Covid 19 patients when coughing and sneezing, asymptomatic individuals can also generate these droplets and infect the populace before they become symptomatic [19]. Current studies show the estimates of a median incubation period is 5 to 6 days with a variability range of 1 to 14 days [20]. Clinically, the disease ranges from asymptomatic to symptomatic conditions such as severe pneumonia with a death prognosis. The clinical distribution of common symptoms includes fever (89%), dry cough (69%), fatigue (37%), dyspnea (20%), sore throat (17%), headache (15%), and myalgia (13%). [20] Other symptoms that are less commonly seen include diarrhea (4%) and vomiting (5%). Fever being the most commonly experienced symptom is a pointer to the application of Digital Infrared thermographic imaging (DITI) to further analyze the heat distribution. Studies have shown that about 80% of reported cases had mild to moderate symptoms, while 13.8% had a severe illness, and about 6.1% had multi-organ and respiratory dysfunctions and septic shock, a case of critical illness that required emergency interventions [21]
Diagnostic modality of COVID-19 disease
The World Health Organization (WHO) advocates the development of rapid and sensitive screening tools for SARS-CoV-2 infection and these are essential to limit the spread of COVID-19 and to properly allocate national resources. The diagnosis of Covid-19 has improved since the disease outbreak in 2019. Laboratory and imaging investigations such as chest X-rays, chest CT, and chest ultrasound have been employed and improved upon. Laboratory investigations include nasopharyngeal swab polymerase chain reaction testing (RT- PCR). Complete blood count, BUN/creatinine, AST, ALT, Total bilirubin, procalcitonin, C-reactive protein, ferritin, D-dimer, interleukin-6, and lactate dehydrogenase. [18]
Imaging findings are frequently absent on presentation and are not used for diagnosis of COVID-19. However, many patients have normal imaging at the time of presentation, but the following abnormalities have been reported on Chest X-ray: bilateral, peripheral, patchy opacities; Chest CT scan: bilateral ground glass opacities, crazy paving, and consolidation [27]. This particular specialized imaging technique is not routinely recommended to avoid unnecessary radiation exposure, Point-of-care ultrasound: B-lines, pleural line thickening, and consolidations with air bronchograms are also observed in Covid-19 patients [26]. Assessment of cardiac function is also useful using 2D Echocardiography[28]. Thermography can be of immense contribution to the diagnosis of symptomatic COVID-19 disease and comorbidity.
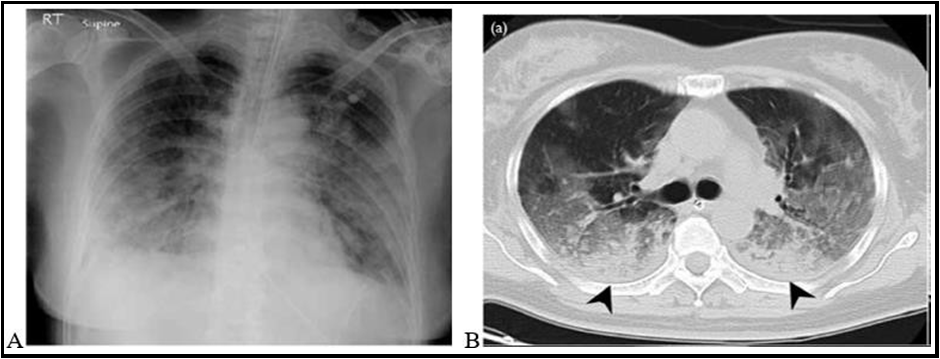
Figure 1: Radiograph of Chest X-ray showing bilateral, patchy opacities in A; Chest CT scan: bilateral ground glass opacities, crazy paving, and consolidation in B [36]
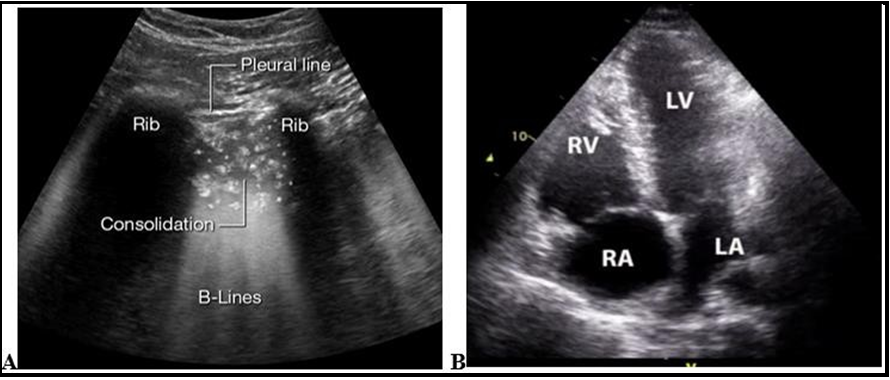
Figure 2: A. Lung ultrasound: with more than 3 B-lines between ribs in a zone without lung sliding and coexisting with consolidations indicative of Covid-19 [37] B. Echocardiogram: showing RV/RA enlargement and a D-shaped LV in a patient with severe COVID-19[38].
Comorbidity of Covid-19 disease
The Center for Disease Control established some probable and possible risk factors which have been associative with severe Covid- 19 disease and death after reviewing some case series, observational studies, meta-analysis and systematic reviews classifies the following as comorbidities of Covid-19 [34,35]: Cancer; Cerebrovascular disease; Children with certain underlying conditions; Chronic kidney disease; Chronic lung disease (interstitial lung disease, pulmonary embolism, pulmonary hypertension, bronchiectasis, COPD); Chronic liver disease (cirrhosis, non-alcoholic fatty liver disease, alcoholic liver disease, autoimmune hepatitis); Cystic fibrosis; Diabetes mellitus, type 1 and type 2; Disabilities (e.g. ADHD, cerebral palsy, congenital malformations, limitations with self-care or activities of daily living, intellectual and developmental disabilities, learning disabilities, spinal cord injuries); Heart conditions (such as heart failure, coronary artery disease, or cardiomyopathies); HIV; Mental health disorders (mood disorders including depression, schizophrenia spectrum disorders); Neurologic conditions (dementia); Obesity (BMI ≥ 30 kg/m2) and overweight (BMI 25 to 29 kg/m2); Physical inactivity; Pregnancy or recent pregnancy; Primary immunodeficiencies; Smoking (current and former); Sickle cell disease or thalassemia; Solid organ or blood stem cell transplantation; Substance use disorders; Tuberculosis and use of corticosteroids or other immunosuppressive medications. Other possible risk factors but with mixed evidence include Alpha 1 antitrypsin deficiency; Asthma; Bronchopulmonary dysplasia; Hepatitis B; Hepatitis C and Hypertension. Studies showed that these comorbidities are associated with severe COVID-19 in adults of all ages. The risk of severe disease also rises steadily with age, with more than 80% of deaths occurring in adults older than age 65 years. People of color are also at increased risk of severe disease and death, often at a younger age, due to systemic health and social inequities [34,35].
Thermography and Cameras
The application of thermography is not limited to medical purposes but for screening in the airport (law enforcement), hunting, and in military defense [3,39]. Conversely, the principle is the same which includes the use of thermograms to study heat distributions in human structures, objects, and environments using special cameras.
Thermographic cameras have evolved dynamically in recent times. In its primordial stage, it was limited to only capturing images. Later it developed into a device for recording videos and was used in the innovative development of night vision photography/videography during World War II. The technology was used by the military to spot enemies during the night for nocturnal advantages. [39] There are types of cameras namely: Infrared and Thermal Cameras. The difference between infrared and thermal is subtle. They use similar energy sources but work in different ways to capture images.
Infrared Camera
Infrared cameras use short wavelengths longer than visible light that reflect some light back to the device when capturing images. It is a non-contact device that supplies information about the wavelength of light from 0.7–300 micrometers. [39] Infrared cameras are the next step from night vision, which is an outdated technology. It bolsters the ambient light to make objects visible using the device from the light reflected back to it. It has many uses, from law enforcement to astronomy to hunting.
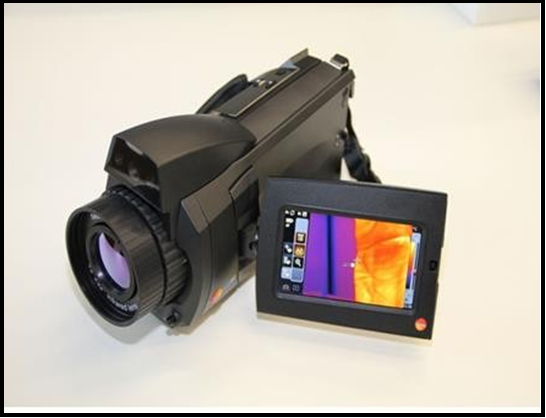
Figure 3: Infrared camera [29]
Thermal Camera
It provides details of the temperature variations in relation to its surroundings and its absolute temperature in degrees Kelvin. It gives more information than an infrared camera, which increases its value and usability. While active IR uses short wavelengths, thermal imaging relies on mid to long wavelengths. The temperature gradients it detects allow its varied uses. It is used by Meteorologists to determine weather patterns and has good applications in hunting and law enforcement. [39] Living things give off heat that is detectable by a thermal camera, this application on humans for medical purposes is the scope of this study.
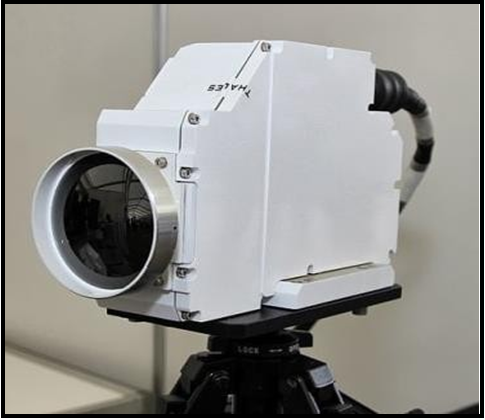
Figure 4: Thermal camera [29]
Medical Thermography (Digital Infrared thermographic Imaging DITI)
Medical Thermography or DITI equipment usually has two parts, the thermal camera, and a standard PC or laptop computer. These systems have only a few controls and are relatively easy to use [29]
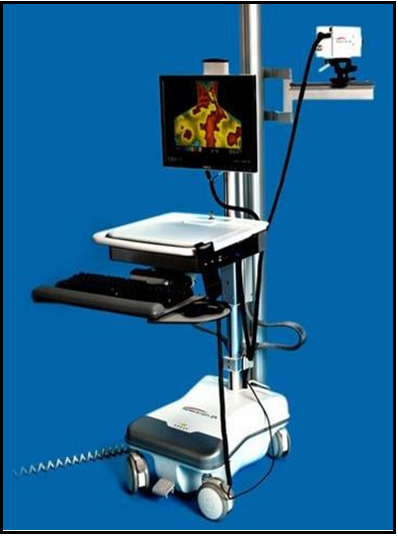
Figure 5: Digital Infrared thermographic Imaging system [29]
This technology has created a more efficient and safer method of measurement. Regular predictive maintenance using thermal imaging products helps save money and consecutively lowers costs. This is due to less downtime, power outages, production losses, fires, etc. Thermal imaging products provide fast and accurate measurements of objects that are difficult or infectious to touch. It allows very accurate temperature measurements from a distance. Is safe and uses non-ionization radiation (infrared) dissipated from the body to produce images. It has a major application in breast pathology, extracranial vessel disease, nerve problems, and arthritis, and in lower extremity vessel diseases [2,22,23,24,25].
All objects at temperatures above absolute zero (-2730C – 459.60F) emit infrared radiation which can be transferred and detected by thermal cameras. These thermal cameras can visualize this radiation and convert it to an image that we can see with our eyes [30]. Thermal cameras (infrared sensors) detect electromagnetic waves of different wavelengths from those of light and are designed to see infrared radiation. The hotter an object, the more infrared radiation is produced from it, which enables the cameras to detect heat radiating off its surface. Thermal cameras measure the temperature of various objects in the frame and then assign each temperature a shade of color. Shades of blue, purple, or green represent colder temperatures. Shades of red, orange, or yellow represent warmer temperatures. Some thermal cameras use a grayscale (white & black) [30]. Inside a thermal camera, there are a bunch of tiny measuring devices that capture infrared radiation, called microbolometers and each is ascribed to each picture element (pixel). The microbolometer records the temperature and then assigns that pixel to an appropriate color [29]. Images from infrared cameras tend to be monochrome. Sometimes these monochromatic images are displayed in pseudo-colour. Multichromatic thermal images are best used for medical purposes.
[40] For use in temperature measurement, the warmest parts of the image are customarily coloured red, with intermediate temperatures of yellows, and greens with a rainbow of color cooling off to blue. Its resolution can achieve a resolution of 1280 x 1024 pixels [29].
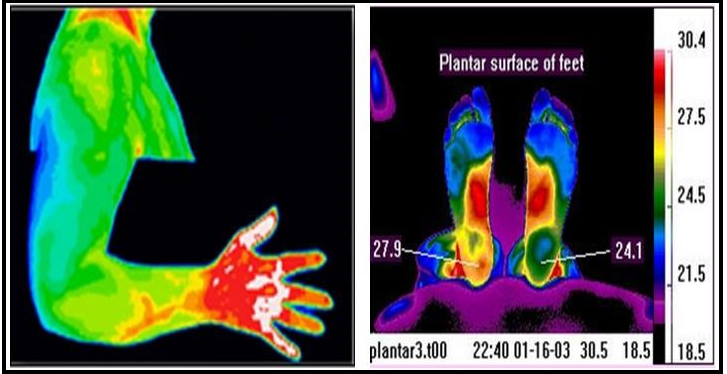
Figure 6: Thermograms of the upper limb and feet showing heat distribution. [29]
Thermal imaging cameras are majorly divided into two classes based on the type of sensor of use: cooled and uncooled. [41] In uncooled thermal cameras, the infrared detecting element operates at room temperature. While cooled thermal cameras, have their detectors stored in a unit at a temperature of -32degree F or below and are more sensitive [30,41]. Uncooled thermal cameras use a sensor operating at ambient temperature, or a sensor stabilized at a temperature close to ambient using small temperature control elements. Modern uncooled detectors all use sensors that work by the change of resistance, voltage, or current when heated by infrared radiation. The sensors are stabilized to an operating temperature to reduce image noise and do not need energy-consuming cryogenic coolers, this makes them short and less costly, but their image quality tends to be lower than cooler detectors [29,30,41].
On the other hand, Cooled detectors are typically contained in a vacuum-sealed case and cryogenically cooled. Cooling is necessary for the operation of the semiconductor materials used because without cooling sensors would be 'blinded' or flooded by their own radiation however, cooling is both energy-intensive and time-consuming. The most commonly used cooling systems are rotary Stirling engine cryocoolers. An alternative to Stirling engine coolers is the use of gases bottled at high pressure and nitrogen is of common choice. Although the cooling apparatus is comparatively expensive, they provide superior image quality compared to uncooled. [29,30,41] Using high-speed computers and very accurate thermal imaging cameras is very important because the heat from the patient's body is processed and recorded in the computer into an image map which can be analyzed on screen, printed, or sent via email. The image map determines if abnormal hot or cold areas are present. These hot and cold areas relate to a number of health conditions [2]. Thermal imaging does not impose any restriction on diet, exercise, or any other physical activity when compared with other imaging modalities [31].
Clinical Application of Digital Infrared Thermographic Imaging (DITI)
Thermographic imaging modality represents the only currently viable mass fever screening approach for outbreaks of infectious disease pandemics such as Ebola virus disease and severe acute respiratory syndrome where a very minimal patient-contact tool is required [42]. This can also be clinically used to define the extent of a lesion of which a diagnosis has previously been made, to localize an abnormal area not previously identified, so further diagnostic tests can be performed, to detect early lesions before they are clinically evident, and also for studying healing process [33]. Medical DITI is filling the gap in clinical diagnosis, X-ray, C.T. Ultrasound, and M.R.I. which are tests of anatomy that require contact with the infectious patient. Thermal imaging is unique in its capability to show physiological changes and metabolic processes especially those seen in Covid-19 patients and requires no contact tool. It has also proven to be a very useful complementary procedure to other diagnostic modalities [33]. Unlike most diagnostic modalities, DITI is non-invasive. It is a very sensitive and reliable means of graphical mapping and displaying skin surface temperature. It is able to evaluate and diagnose various conditions including soft tissue injury and sensory fiber dysfunction [31,33]. Results obtained with medical DITI systems are totally objective and show excellent correlation with other diagnostic tests [33,42]. Infrared (IR) devices of DITI consist of wide focal plane array (FPA) detectors of about 1280 × 1024 pixels, which provide an excellent collection of temperature maps (thermograms) with high Non-Equivalent Temperature Difference (NETD, ~30 mK) and dot pitch (~25–40 µm) [32].
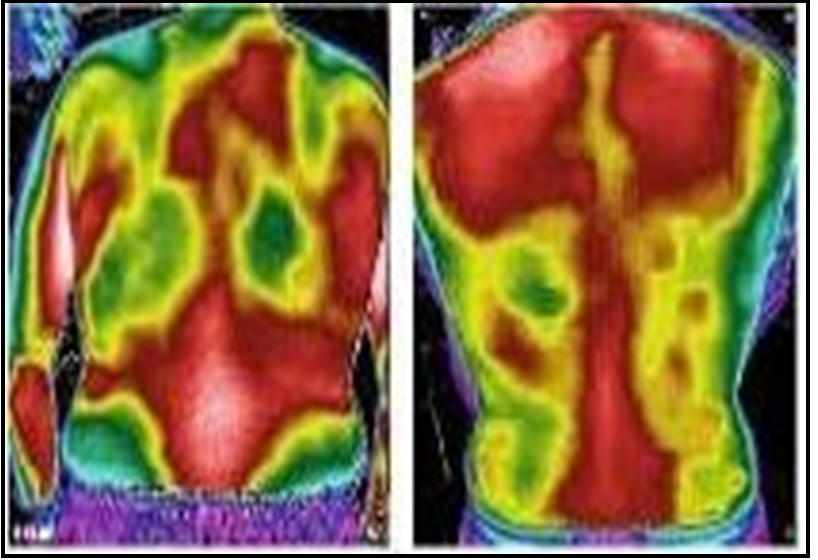
Figure 7: Thermal image of a Covid-19 patient, A: shows Lung injury, B: shows normal Lungs [44]
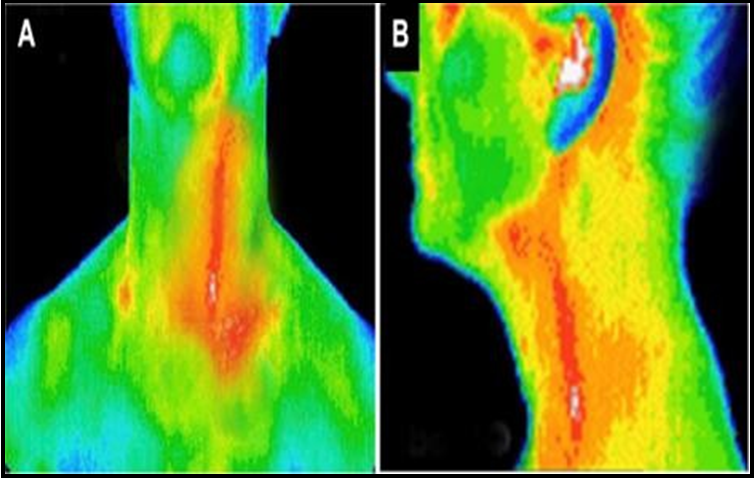
Figure 8: Thermograms of vascular conditions demonstrating the aortic arch and left carotid artery in anteroposterior (A) and lateral (B) views in a patient with arteritis [39]
Comparison of Medical Imaging Modalities in Chronic Osteomyelitis
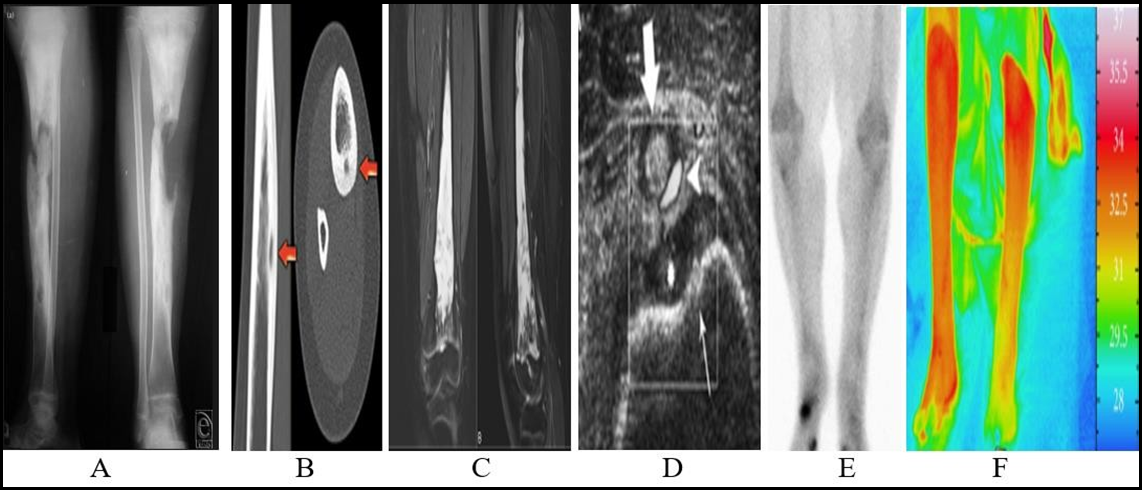
Figure 9: Both legs showing chronic osteomyelitis lesions, A: X-ray, B: CT, C: MRI, D: Ultrasound, E: Radionuclide imaging, and F: Thermogram
Limitations of Thermography
The accurate temperature measurement mechanism of IR cameras may be hindered by differing emissivity and reflections from surfaces and images may be difficult to interpret in specific objects having erratic temperatures. Thermal imaging cameras are not used for the study of underwater objects. Most of the thermal imaging cameras have +/-2% accuracy or worse for temperature measurement and are not as accurate as contact methods. The IR cameras cannot see through glass as thermal energy can be reflected off [2]. Morphological characteristics of disease patterns may not be well displayed by thermal imaging like other imaging modalities but confirm the presence of temperature differences in the skin-surface and organ structures. Thermography adds little but early signs of disease conditions to what physicians already know based on history, physical examination, and other diagnostic studies [1]. Therefore, limitations would be encountered in the diagnosis of asymptomatic COVID-19 patients since patients with partial or full asymptomatic COVID-19 disease may not exhibit fever as a symptom and all the organs are normal, classical DITI evaluations will depict normal general skin surface heat distribution but would be valuable in symptomatic scenario.
Conclusion and Recommendation
The introduction of thermographic imaging modality in the protocol of symptomatic COVID-19 disease and comorbidity diagnosis cannot be over-emphasized as the modality is non-invasive, with no radiation to the patient, no contact tool with the patient in the avoidance of the spread of the infection, very sensitive and reliable in body infrared graphic mapping and displaying skin surface temperature in a colored or black and white thermogram format for interpretation. Its application can be employed in mild, moderate, and severe stages of Covid-19 disease other than generalized fever such as upper and lower respiratory disorders, cases of pneumonia, and lung fibrosis. It is also valuable in the management of the comorbidity conditions of COVID-19 disease, such as cardiovascular and extracranial vessel diseases, neuromusculoskeletal and lower extremity disease (osteomyelitis), diabetic organ complications, breast pathologies, and all inflammatory process diseases. To define the extent of a lesion of which a diagnosis has previously been made, to localize an abnormal area not previously identified so further diagnostic tests can be performed, to detect early lesions before they are clinically evident, and to monitor the healing process before the patient is returned to work or training. The limitation of this modality is not limited only to the fact that it lacks the ability to provide information on morphological characteristics of diseased tissues and or organs but also asymptomatic conditions such as fever. The technology of TI is required to be further enhanced to improve the morphologic characteristics of diseases with more detailed anatomical presentation.
References
- Barret S (2018) A Critical Look at the Use of Thermography by Chiropractors. Chirobase.
- Kimberly S (2018) Overview of digital infrared thermal imaging.
- Perpetuini D, Filippini C, Cardone D, Merla A (2021) An Overview of Thermal Infrared Imaging-Based Screenings during Pandemic Emergencies. Int. J. Environ. Res. Public Health. 18(6): 3286.
- International Association of Medical Thermographers (2018) History of Thermography, All Rights Reserved.
- Zimmermann D (2018) Properties of Infrared Light. Sciencing Team: Leaf Group Ltd.
- Steve J (2017) The basic physics for thermography [ONLINE] is available at https://www.thermal-imaging.
- Ksiazek TG, Erdman D, Goldsmith CS, Zaki SR, Peret T, et al (2003) A novel coronavirus associated with severe acute respiratory syndrome. N Engl J Med. 348(20): 1953–1966.
- Zheng M, Gao Y, Wang G, Song G, Liu S, et al. (2020) Functional exhaustion of antiviral lymphocytes in COVID-19 patients. Cell Mol Immunol. 17(5): 533-535.
- Zhang J, Litvinova M, Wang W, Wang Y, Deng X, et al. (2020) Evolving epidemiology and transmission dynamics of coronavirus disease 2019 outside Hubei province, China: a descriptive and modeling study. Lancet Infect Dis. 20(7): 793- 802.
- Huang C, Wang Y, Li X, Ren L, Zhao J, et al. (2020) Clinical features of patients infected with 2019 novel coronavirus in Wuhan, China. Lancet. 395(10223): 497–506.
- Shi H, Han X, Jiang N, Cao Y, Alwalid O, et al. (2020) Radiological findings from 81 patients with COVID-19 pneumonia in Wuhan, China: a descriptive study. Lancet Infect Dis. 20(4): 425–434.
- Zhou F, Yu T, Du R, Fan G, Liu Y, et al. (2020) Clinical course and risk factors for mortality of adult inpatients with COVID-19 in Wuhan, China: a retrospective cohort study. Lancet. 395(10229): 1054–1062.
- Lu X, Zhang L, Du H, Zhang J, Li YY, et al. (2020) SARS-CoV- 2 infection in children. N Engl J Med. 382(17): 1663-1665.
- Qiu H, Wu J, Hong L, Luo Y, Song Q, et al. (2020) Clinical and epidemiological features of 36 children with coronavirus disease 2019 (COVID-19) in Zhejiang, China: an observational cohort study. Lancet Infect Dis. 20(6): 689-696.
- Cao B, Wang Y, Wen D, Liu W, Wang J, et al. (2020) A trial of Lopinavir-ritonavir in adults hospitalized with severe Covid-19. N Engl J Med. 382(19): 1787-1799.
- Gautret P, Lagier JC, Parola P, Hoang VT, Meddeb L, et al. (2020) Hydroxychloroquine and azithromycin as a treatment of COVID- 19: results of an open-label non-randomized clinical trial. Int J Antimicrob Agents. 56(1): 105949.
- World Health Organization (2020) Clinical management of severe acute respiratory infection (SAR1) when COVID-19 disease is suspected.
- Gao Y, Li T, Han M, Li X, Wu D, et al. (2020) Diagnostic utility of clinical laboratory data determinations for patients with the severe COVID-19. J Med Virol. 92(7): 791-796.
- Rothe C, Schunk M, Sothmann P, Bretzel G, Froeschl G, et al. (2020) Transmission of 2019-nCoV infection from an asymptomatic contact in Germany. N. Engl. J. Med. 382(10): 970–971.
- Backer J.A., Klinkenberg D, Wallinga J (2020) Incubation period of 2019 novel coronavirus (2019-nCoV) infections among travelers from Wuhan, China, 20–28 January 2020. Eurosurveillance. 25(5): 2000062.
- Eurosurveillance editorial team (2020) Updated rapid risk assessment from ECDC on the novel coronavirus disease 2019 (COVID-19) pandemic: Increased transmission in the EU/EEA and the UK. Eurosurveillance. 25(10): 2003121.
- Kennedy D.A, Lee T, Seely D (2009) A comparative review of thermography as a breast cancer screening technique. Integr. Cancer Ther. 8(1): 9-16.
- Sanchis-Sánchez E, Vergara-Hernández C, Cibrián RM, Salvador R, Sanchis E, et al. (2014) Infrared thermal imaging in the diagnosis of musculoskeletal injuries: A systematic review and meta-analysis. Am. J. Roentgenol. 203(4): 875–882.
- Hernandez-Contreras D, Peregrina-Barreto H, Rangel-Magdaleno J, Gonzalez-Bernal J (2016) Narrative review: Diabetic foot and infrared thermography. Infrared Phys. Technol. 78: 105–117.
- Perpetuini D, Trippetti N, Cardone D, Breda L, D’Attilio M, et al. (2021) Detection of temporomandibular joint dysfunction in juvenile idiopathic arthritis through infrared thermal imaging and a machine learning procedure. 8th European Medical and Biological Engineering Conference. Switzerland. 372–381.
- Jiang ZZ, He C, Wang DQ, Shen HL, Sun JL, et al. (2020) The role of imaging techniques in management of COVID-19 in China: from Diagnosis to Monitoring and Follow-Up. Med Sci Monit. 26: e924582-1–e924582-10.
- Wei J, Xu H, Xiong J, Shen Q, Fan B, et al. (2020) 2019 Novel Coronavirus (COVID-19) pneumonia: serial computed tomography findings, Korean J. Radiol. 21(4): 501–550.
- Nagueh SF, Smiseth OA, Appleton CP, Byrd BF, Dokainish H, et al. (2016) Recommendations for the evaluation of left ventricular diastolic function by echocardiography: an update from the American Society of Echocardiography and the European Association of Cardiovascular Imaging. J Am Soc Echocardiogr. 29(4): 277–314.
- Carlos C (2012) Image formation within IR cameras for improved archival uses.
- Opgal (2021) introduction to IR (part 1): the physics behind thermal imaging.
- Craig L (2017) How the thermography imaging works.
- Rogalski A (2010) Infrared Detectors; CRC Press: Boca Raton, FL, USA. ISBN 1-4200-7672-8.
- Meditherm, Inc. (2021) Meditherm thermal imaging cameras.
- Centers for Disease Control and Prevention (2024) Underlying medical conditions associated with high risk for severe COVID- 19: Information for healthcare providers.
- Centers for Disease Control and Prevention (2022) Science brief: Evidence used to update the list of underlying medical conditions that increase a person's risk of severe illness from COVID-19.
- Woo SC, Yung KS, Wong T, Yu ELM, Li SK, et al. (2020) Imaging findings of critically ill patients with COVID-19 pneumonia: a case series. Hong Kong Med J. 26(3): 236-239.
- Kanasz J, Brownstein M (2020) Lung Ultrasound and COVID-19. Block Buddy.
- Pimentel SLG, Nascimento BR, Franco J, Oliveira KKB, Fraga CL, et al. (2021) Bedside echocardiography to predict mortality of COVID-19 patients beyond clinical data: Data from the PROVAR-COVID study. Rev. Soc. Bras. Med. Trop. 54: e03822021.
- Lin PH, Echeverria A, Poi MJ (2017) Infrared thermography in the diagnosis and management of Vasculitis. Journal of Vascular Surgery-Case Innovation and Technique. 3(2): 112-114.
- Ressel L (2021) Spectral Analysis of multichromatic thermographic measurement principles. Master Thesis. Institute of Solar Research. 27.
- a & s Editorial Team. Thermal cameras: Cooled and uncooled sensors. 27 Dec. 2013. Asmag.com.
- Ghassemi P, Pfefer TJ, Casamento JP, Simpson R, Wang Q (2018) Best practices for standardized performance testing of infrared Thermographs intended for fever screening. PLoS ONE 13(9): e0203302.
- Fiscal MRC, Treviño V, Treviño LJR, López RO, Cardona Huerta S, et al. (2022) COVID-19 classification using thermal images. J Biomed Opt. 27(5): 056003.
- Brzezinski RY, Rabin N, Lewis N, Peled R, Kerpel A, et al. (2021) Automated processing of thermal imaging to detect COVID-19. Sci Rep. 11(1): 17489.