


Saed J. Al Atawneh*
Doctoral School of Physics, Faculty of Science and Technology, University of Debrecen, P.O.400, Debrecen, Hungary
*Corresponding Author: Saed J. Al Atawneh, Doctoral School of Physics, Faculty of Science and Technology, University of Debrecen, P.O.400, Debrecen, Hungary
Abstract
In this work, we present the practical method/technique to measure or/and verify the absolute dose and dose distributions (dose mapping) on the real patients during radiotherapy sessions, especially, head and neck patients (HN) who had dental fillings. Where our investigation was focused on how does the dental filling effect those measurements. Films were placed in the oral cavity of the patients near to dental filling, and the CT- scan of the patients using a Siemens CT-scanner with 3 mm slice thickness were performed. Intensity-modulated radiation therapy (IMRT) treatment plans were generated using the Eclipse Treatment Planning System. The measurements were evaluated using the ImageJ film analysis software program. The analysis was performed using 2D Gamma index (γ) with a variety of dose-difference (DD) and distance-to-agreement (DAT): 5 %:3 mm. The average γ values and percentages of pixels passing the γ criteria were obtained. We found that the Film-Styrofoam combination technique can be reliably used for the HN in-vivo dosimetry during radiotherapy sessions, precisely.
Keywords: EBT3, film dosimetry, In-Vivo dosimetry, Dose measurement in radiotherapy.
1. Introduction
Cancer patients who undergo radiotherapy for head and neck tumors and who have dental fillings, dental implements, and/or other non-removable devices in their mouth have shown bad dose distributions due to the metallic artifact [1]. Metal implants are made of chemical elements with a high atomic number, which may perturb the dose distribution and may also lead to under or overdose. This phenomenon is responsible for the enhancement of radiation-induced mucositis, in serious cases ulcerative lesions in the oral mucosa, which lead to widespread pain and weight loss [2-8]. In this context, the tissue density heterogeneities are the main difficulties to overcome and have called for continuous progress in algorithms. In spite of the current algorithm being able to take into account the heterogeneity correction, i.e. Anisotropic Analytical Algorithm (AAA) implemented with Eclipse® Treatment Planning System (TPS). The absolute dose and the dose distribution should be investigated directly and compared with the calculated one by TPS [9]. The Gafchromic film (EBT3) represents a new era of self-developing films that can be used in medical practice [10,11]. As a consequence, self-developing films have an ever-growing role in the dose verification of radiotherapy treatment plans because of their precision and their lack of requirement for the costly and space-demanding equipment [10,11].
Lin et al, Shimamoto et al and Pradhan et al studies provide descriptions for the dose measurement in the presence of high-Z material (dental filling-like materials) utilizing homogeneous water phantom and polystyrene phantom [1,12-14]. Spirdovich et al describe the use of the (EBT3) film, fluence map Monte Carlo (FMMC), and superposition algorithm in the solid water phantom to verify the dose distribution in the presence of high-Z materials [15]. Several studies describe the Gafchromic films as a useful method for (2D) dose map visualization of the IMRT and VMAT fields [16-19]. Shimozato et al, De Conto et al and Mail et al described the dose measurement in the presence of metals and high-density materials using jaw phantom (human-like phantom) utilizing TLD, EBT2 films, and Gafchromic films [1, 20-22]. But none of the previous studies have developed any techniques or procedures to measure the absolute dose nor the dose distribution (dose mapping) for the real patients directly “i.e. in-vivo dosimetry”. Along this side, in this paper, we present the new method/technique to verify the absolute dose and dose distributions (dose mapping) as an in-vivo dosimetry procedure for the real head and neck (HN) patients, particularly in the presence of high-density materials such as a dental filling.
2. Method and Materials
2.1 Material
The linear accelerator employed in this study was a dual-energy Varian DHX-2300C linac (Varian Medical Systems) outfitted with a Millennium 120 leaf MLC. It generates photon beam energies of 6, 10, and 15MV. For film digitization and assessment, an automated film scanner (an Epson Expression 11000XL) was utilized in conjunction with image analysis software (ImageJ).
2.2 Methodology
2.2.1 Film calibration
Initially, the large Gafchromic Film was cut into small samples with 4×10 cm2 for each [18] and then the small film pieces were placed on solid water slabs made up of 30 × 30 cm3 (see figure 1). Films were covered via 1.5 cm of the build-up material (slabs) and different dose levels were measured starting from 0.5, 1.3, 1.7, 2, 2.5 up to 5.0 Gy (see figure 2). For dose calibration, a calibrated Wellhofer Farmer ion chamber (sensitive volume is 0.65 cm3) had already been inserted in the slab phantom (solid water slab phantom). The dose measurements were performed according to the IAEA-TRS 398 protocol [23] using a 10×10 cm2 field size, 100 cm SSD, 1.5 cm depth, and 6MV photon beam, The calibration curve was obtained.
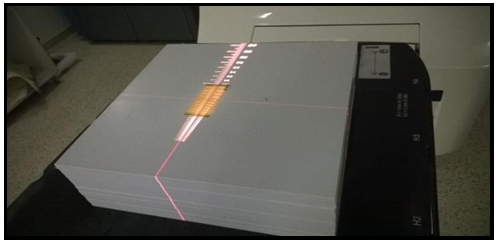
Figure 1. The film calibration set up, the film (EBT3) sample (4×10 cm2) positioned on the top of solid water phantom with the soruce to the surface distance (SSD) 100 cm, 10 x10 cm2 field size, and 6MV beam energy.

Figure 2. Calibration series films (0.5-5Gy).
2.2.2 Film Scanning
The irradiated films were placed precisely at a similar place of the automatic film scanner surface to minimize the effect of the lateral dependence artifacts (the non-uniform response of the readout due to the light scattering of the scanner lamp caused by particles in the film active layer) [24], a 4×10 cm2 cardboard template was fitted to the scanner to position films at a reproducible central location of the scan surface that can be considered uniform [18]. To confirm this assumption, five optical density (OD) measurements over the scanner central area were performed, resulting in a standard error of less than 0.12 %. Images were acquired in a professional mode and landscape orientation, as recommended by the manufacturer because the lateral response artifact on scanners is smaller in this orientation compared to portrait orientation [24]. Images were collected with the color correction turned off mode, a spatial resolution of 72 dpi, and finally saved in tiff format. Raw images of irradiated films were imported from the scanning system into a distinctive film analysis software program for analysis and evaluation.
2.2.3 Physical assessment of the film.
A 4 x 10 cm2 film was irradiated before being split into three regions of interest (ROIs), which were located at 1 cm from each side of 4x10 cm2 film. And hence, the film samples were digitalized and assessed by ImageJ analysis software programs (see figure 3).
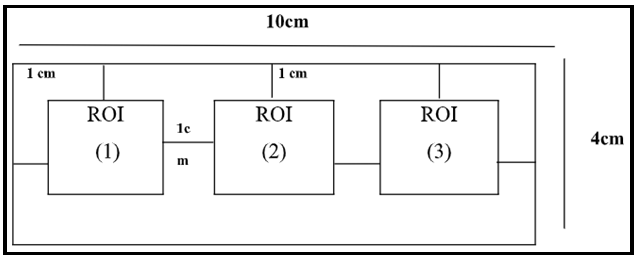
Figure 3. Schematic view of the Gafchromic Film, a 4 x 10 cm2 film sample which cut into three equal regions each region of interest (ROI) with 2x2 cm2 area.
3. Clinical application
3.1 Patient Selection
Eighteen HN patients with different diagnoses and various stages were selected and asked to participate in these investigations and their approval was taken. These patients were treated with a five‐beam Static-IMRT technique for definitive intent (see table 1).
Table 1. Eighteen HN patients (P1-P18) with different diagnoses and various stages, all patients had a dental filling during the RT treatment course.
|
Patients |
Old (years) |
Prescribed Dose (Gy) |
Tumor Stage |
Diagonsis |
Filling Location |
|
P1 |
63 |
1.26 |
T2N2Mx |
hypopharynx |
second molar |
|
P2 |
69 |
1.71 |
T3N1 |
larynx |
second premolar |
|
P3 |
62 |
1.71 |
T3N1 |
larynx |
second molar |
|
P4 |
64 |
1.71 |
T3N2 |
larynx |
middle incisor |
|
P5 |
69 |
1.32 |
T2N1 |
larynx |
second premolar |
|
P6 |
62 |
1.71 |
T3N2 |
larynx |
second molar |
|
P7 |
64 |
1.71 |
T3N2 |
larynx |
middle incisor |
|
P8 |
42 |
1.89 |
T4NoMx |
nasal cavity |
second premolar |
|
P9 |
70 |
0.9 |
TxNoMo |
pharynx |
second molar |
|
P10 |
60 |
0.9 |
T1N1Mo |
pharynx |
second premolar |
|
P11 |
78 |
0.9 |
T1N2Mo |
pharynx |
second premolar |
|
P12 |
73 |
1.1 |
T3N1Mx |
base of tongue |
second premolar |
|
P13 |
55 |
1.69 |
T3N3Mo |
base of tongue |
second premolar |
|
P14 |
65 |
1.22 |
T2N2Mx |
hypopharynx |
second premolar |
|
P15 |
58 |
0.93 |
T2N2M1 |
hypopharynx |
second molar |
|
P16 |
70 |
0.88 |
T3NoMo |
glottis |
second molar |
|
P17 |
61 |
0.76 |
T4N2Mo |
glottis |
middle incisor |
|
P18 |
63 |
1.84 |
T3N2Mo |
glottis |
middle incisor |
Table 1 shows the HN patients with their olds, tumor doses, tumor stages, diagnoses, and various dental filling locations. 33 % of patients have been diagnosed with larynx cancers and 16.67 % of The total patients have been diagnosed with glottis, Pharynx, and hypopharynx cancers. Whilst 11% of patients have the base of tongue cancers and 5 % of patients with nasal cavity cancers. All of the tumor sites were prescribed a specific dose according to RTOG protocols
3.2 IMRT Planning
The aim of the present work is in-vivo dosimetry for head and neck patients. Therefore, a five-field coplanar treatment plan with beam angles of 72°, 144°, 216°, 288°, and 360° was generated with a 6MV flattened X-ray beam using a VARIAN accelerator with 120 multileaf collimators (MLC), see figure 4. Eighteen patients who had undergone IMRT for HN cancer in our institution between February 2019 and September 2019 were enrolled in this study. A radiation oncologist delineated the contour of the planning target volume (PTV) as the target, and then a medical physicist manually delineated the metallic dental prostheses area and assign the CT number in order to reduce the artifact. Thus, the IMRT plan was created. A daily dose was prescribed for the planning target volume (PTV) for all patients as shown in table 1. Treatment plans were created using the Eclipse treatment planning system (TPS) and a dose calculation algorithm was an Anisotropic Analytical Algorithm (AAA) with a voxel size of 4.0 × 4.0 × 4.0 mm3.
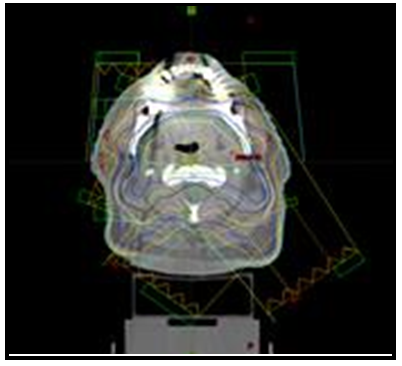
Figure 4. The axial planning CT scan, showing the isodose curve. Also show the locations of the amalgam dental fillings. Note significant CT scatter due to metallic dental prostheses.
3.3 In-vivo dosimetry
The film (2 mm thickness) was covered by Styrofoam (1x5 cm2) to avoid mechanical injury and to prevent direct contact with the patients (see figure 5).
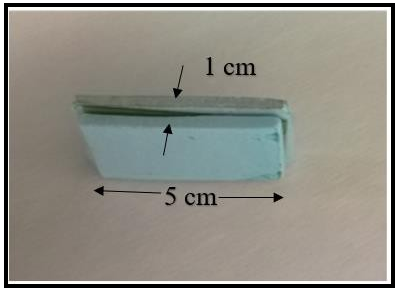
Figure 5. Picture of Film-Styrofoam companions (2 mm thickness) with Styrofoam of 1x5 cm2 area, inserted near to the dental filling of patients during RT treatment course.
The Film-Styrofoam companions were placed on the maxillary side near to dental fillings and the patients were instructed to bit on the Styrofoam during their treatments. Patients’ masks were affixed, and geometrical positioning and image-guided via cone-beam computed tomography (CBCT) were performed. Film-Styrofoam location was guided by CT-image. The location of Styrofoam was checked during and after the treatment session to ensure there was no alteration in the film location.
3.4 Evaluation
The irradiated films were scanned and analyzed by the imageJ analysis software program, calibrated and compared in absolute mode with the calculated dose map (reference data) using the gamma analysis approach. A ROI encompassing the area within about 1 cm from the film edge was defined and the number of points satisfying the condition (pass‐rate) was calculated, using gamma evaluation criteria for dose difference (DD) and distance to agreement (DTA) [18]. The gamma calculation criteria was set to 3 mm. The DD criterion were calculated relative to the prescription dose with 5 % tolerance. Points that lie outside the defined agreement tolerance can be easily distinguished on the compared dose map.
4. Results and Discussion
4.1 Physical properties of the film
We found that the irradiated film had shown good stability behavior at 4Gy. The temporal evaluation of the films revealed that the relative difference between the measured and the calculated doses decreased after the first couple of hours and increased again after a few days of irradiation using distinctive film analysis software programs (ImageJ).
See Figure 6 shows the relative difference (%) as a function of time (h) for ImageJ film analysis software program. The ImageJ software shows the lower fluctuation value within the 2h-72h period as well as the highest fluctuation after 72h period. The comprehensive evaluation confirmed that the optimal time interval for the scanning and analysis of the films should be within 24h to 48h after irradiation.
Within this interval, the mean relative difference (%) was calculated and the relative difference was (-0.44±0.14), (see Figure 6).

Figure 6. The mean relative differences (%) versus time (h) for ImageJ film analysis software programs.
4.2 In vivo dosimetry for real patients
The dose measurements on the surface of the dental filling were performed for eighteen HN patients and these data were compared to calculate dose (TPS) (see table 2).
Table 2. The Dose-differences (TPS vs Calibrated films), Distance-To-Agreements (DTA), and a number of passing pixels for eighteen patients.
|
Patients |
Eclipse Dose (Gy) |
Image J measured (Gy) |
Dose-Difference (DD): [5 %] |
Distance-To-Agreement (DTA): [3 mm] |
No. of passes pixels (Five Fields) |
|
P1 |
1.26 |
1.32 |
3.20 % |
1.94 |
(94.3 %-96.7 %) 93.8 % ± 2.0 % |
|
P2 |
1.71 |
1.73 |
1.20 % |
1.03 |
(97.1 %-99.1 %) 97.9 % ± 1.21 % |
|
P3 |
1.71 |
1.73 |
1.20 % |
1.038 |
(98.1 %-99.0 %) 97.58 % ± 1.03 % |
|
P4 |
1.71 |
1.73 |
1.20 % |
1.52 |
(96.0 %-97.8 %) 96.6±0.78 % |
|
P5 |
1.32 |
1.26 |
3.20 % |
1.99 |
(92.4 %-96.7 %) 94.28 % ± 1.26 % |
|
P6 |
1.71 |
1.72 |
1.18 % |
1.99 |
(94.3 %-97.3 %) 95.82±1.085 % |
|
P7 |
1.71 |
1.73 |
1.20 % |
1.45 |
(95.0-97.8 %) 96.66±1.03 % |
|
P8 |
1.89 |
1.95 |
3.20 % |
1.98 |
(91.3 %-94.3 %) 93.38±1.98 % |
|
P9 |
0.9 |
0.96 |
3.20 % |
1.77 |
(92.0 %-96.6 %) 94.68±1.87 % |
|
P10 |
0.9 |
0.94 |
2.13 % |
2.0 |
(90.4 %-94.7 %) 92.06 % ± 1.69 % |
|
P11 |
0.9 |
0.95 |
3.18 % |
2.22 |
(91.4 %-95.7 %) 92.72 % ± 1.99 % |
|
P12 |
1.1 |
1.15 |
2.66 % |
1.026 |
(98.4 %-99.3 %) 98.52 % ± 0.61 % |
|
P13 |
1.69 |
1.75 |
3.20 % |
1.94 |
(92.4 %-94.7 %) 93.82 % ± 2.05 % |
|
P14 |
1.22 |
1.28 |
3.20 % |
1.63 |
(96.4 %-98.7 %) 96.42 % ± 1.70 % |
|
P15 |
0.93 |
0.99 |
3.20 % |
1.67 |
(95.4 %-97.7 %) 96.22 % ± 1.12% |
|
P16 |
0.88 |
0.92 |
2.13 % |
1.98 |
(92.4 %-96.7 %) 94.28 % ± 1.26 % |
|
P17 |
0.76 |
0.8 |
2.13 % |
1.81 |
(95.8 %-96.7 %) 95.66 % ± 0.77 % |
|
P18 |
1.84 |
1.9 |
3.20 % |
1.04 |
(97.4 %-99.7 %) 97.4 % ± 1.54 % |
Table 2 shows the dose-difference values, Distance-to-Agreement values, and a number of passes pixels for eighteen patients respectively, the percentage of points passing the 5 % /3 mm criteria, averaged over all tests were 93.8 % ± 2.0 % with a corresponding confidence interval between 93.4 % and 96.7 % for the patient 1 for example, a 97.9 % ± 1.21 % with a corresponding confidence interval between 94.3% and 96.7 % for patient 2, and a 97.58 % ± 1.03 % with a corresponding confidence interval between 97.1 % and 99.1 % for patient 3 and so on so forth. In the terms of dose-deference, the calculated (TPS) doses for the first three patients were 1.26Gy, 1.71Gy, and 1.71Gy in sequence and the measured doses by the films were 1.32Gy, 1.73Gy, and 1.73Gy, respectively The maximum dose deviation of the patients was less than 4 %.
5. Conclusion
The Film-Styrofoam combination technique for the HN in-vivo dosimetry was presented. Our investigations were based on HN patients, who had a dental filling. Films were placed in the oral cavity of the patients near to dental filling, and the CT-scan of the patients using a Siemens CT-scanner with 3 mm slice thickness were performed. We used ImageJ film analysis software program for evaluation of the irradiation samples and we found that the evaluation program was reasonable for the analysis and assessment of the Gafchromc films.
We also found that the maximum dose-difference on the surface of the dental fillings of the patients was 3.20 % with the Distance -To-Agreement value is 2.22 mm. In this point of view, the film can be reliably used for the HN in-vivo dosimetry, dose calibration, and also for quality assurance (QA) in radiotherapy and strongly recommend using it in cases where the possibility to place ion chamber or surface diode is limited.
Patient Consent: Eighteen Head and Neck patients were asked to participate in this study and their approvals were obtained based on hospital rules and regulations.
References
- Fuller CD, Diaz I, Cavanaugh SX, Eng TY (2004) In vivo dose perturbation effects of metallic dental alloys during head and neck irradiation with intensity modulated radiation therapy. Oral Oncology. 40(6): 645-648.
- Glide-Hurst C, Chen D, Zhong H, Chetty IJ (2013) Changes realized from extended bit-depth and metal artifact reduction in CT. Med Phys. 40(6): 061711.
- Maerz M, Mittermair P, Krauss A, Koelbl O, Dobler B (2016) Iterative metal artifact reduction improves dose calculation accuracy : Phantom study with dental implants. Strahlenther Onkol. 192(6): 403-13.
- Maerz M, Koelbl O, Dobler B (2015) Influence of metallic dental implants and metal artefacts on dose calculation accuracy. Strahlenther Onkol. 191(3): 234-41.
- Mail N, Albarakati Y, Ahmad Khan M, Saeedi F, Safadi N, et al. (2013) The impacts of dental filling materials on RapidArc treatment planning and dose delivery: challenges and solution. Med Phys. 40(8): 081714.
- Kim Y, Tomé WA (2007) Tome, On the radiobiological impact of metal artifacts in head-and-neck IMRT in terms of tumor control probability (TCP) and normal tissue complication probability (NTCP). Med Biol Eng Comput, 2007. 45(11): 1045- 51.
- Nakae Y, Inoue H, Minamoto T, Yamamoto T, Johkou T (2007) [influence and improvement of metal artifacts in dental structures by CT for radiation treatment planning: reconstruction of transverse images using oblique images by gantry tilt scanning]. Nihon Hoshasen Gijutsu Gakkai Zasshi. 63(3): 326-34.
- Kim Y, Tomé WA, Bal M, McNutt TR, Spies L (2006) The impact of dental metal artifacts on head and neck IMRT dose distributions. Radiother Oncol. 79(2): 198-202.
- Ouyang Z, Shen ZL, Murray E, Kolar M, LaHurd D, et al. (2019) Evaluation of auto-planning in IMRT and VMAT for head and neck cancer. Journal of Applied Clinical Medical Physics. 20(7): 39-47.
- Niroomand-Rad A, Chiu-Tsao ST, Grams MP, Lewis DF, Soares CG, et al. (2020) Report of AAPM Task Group 235 Radiochromic Film Dosimetry: An Update to TG-55. Medical Physics. 47(12): 5986-6025.
- Niroomand-Rad A, Blackwell CR, Coursey BM, Gall KP, Galvin JM, et al. (1988) Radiochromic film dosimetry: recommendations of AAPM Radiation Therapy Committee Task Group 55. American Association of Physicists in Medicine. Med Phys. 25(11): 2093-115
- Lin M-H, Li J, Price Jr RA, Wang L, Lee CC, et al. (2013) The dosimetric impact of dental implants on head-and-neck volumetric modulated arc therapy. Physics in medicine and biology. 58(4): 1027-1040.
- Shimamoto H, Sumida I, Kakimoto N, Marutani K, Okahata R, et al. (2015) Evaluation of the scatter doses in the direction of the buccal mucosa from dental metals. Journal of Applied Clinical Medical Physics. 16(3): 5374.
- Pradhan AS, Gopalakrishnan AK, Iyer PS (1992) Dose measurement at high atomic number interfaces in megavoltage photon beams using TLDs. Medical Physics. 19(2): 355-356.
- Spirydovich S, Papiez L, Langer M, Sandison G, Thai V (2006) High density dental materials and radiotherapy planning: Comparison of the dose predictions using superposition algorithm and fluence map Monte Carlo method with radiochromic film measurements. Radiotherapy and Oncology. 81(3): 309-314.
- Cheung T, Butson MJ, Yu PKN (2005) Post-irradiation colouration of Gafchromic EBT radiochromic film. Phys Med Biol. 50(20): N281-5.
- Micke A, Lewis DF, Yu X (2011) Multichannel film dosimetry with nonuniformity correction. Med Phys. 38(5): 2523-34.
- Casanova Borca V, Pasquino M, Russo G, Grosso P, Cante D, et al. (2013) Dosimetric characterization and use of GAFCHROMIC EBT3 film for IMRT dose verification. J Appl Clin Med Phys. 14(2): 4111.
- McLaughlin WL, Soares CG, Sayeg JA, McCullough EC, Kline RW, et al. (1994) The use of a radiochromic detector for the determination of stereotactic radiosurgery dose characteristics. Med Phys. 21(3): 379-88.
- Shimozato T, Igarashi Y, Itoh Y, Yamamoto N, Okudaira K, et al. (2011) Scattered radiation from dental metallic crowns in head and neck radiotherapy. Physics in medicine and biology. 56(17): 5525-34.
- De Conto C, Gschwind R, Martin E, Makovicka L (2014) Study of dental prostheses influence in radiation therapy. Physica Medica. 30(1): 117-121.
- Mail N, Albarakati Y, Khan MA, Saeedi F, Safadi N, et al. (2013) The impacts of dental filling materials on RapidArc treatment planning and dose delivery: Challenges and solution. Medical Physics. 40(8): 081714.
- Shimohigashi Y, Araki F, Maruyama M, Nakaguchi Y, Kuwahara S, et al. (2015) Evaluation of a single-scan protocol for radiochromic film dosimetry. Journal of applied clinical medical physics / American College of Medical Physics. 16(2): 412-424.