


Connell W.C. Boal1,2*, Tom Patton1,2, John Barrett1,2, R.D. Boyle2, M. Ehrensberger2, Ailish Breen1,3
1Department of Life Sciences, Atlantic Technological University, ATU Sligo, Ireland
2Nektr Technologies, Finisklin Business Park, Sligo, Ireland
3Precision Engineering and Manufacturing (PEM) Research Centre and Health and Biomedical Research Centre (HEAL) ORCID: 0000-0001- 8888-2711
*Corresponding Author: Connell W.C. Boal, Department of Life Sciences, Atlantic Technological University, ATU Sligo, Ireland Nektr Technologies, Finisklin Business Park, Sligo, Ireland. Email: connellboal@gmail.com; Author’s ORCID: 0000-0003-3811-5527
Abstract
Background: Healthcare-associated infections (HCAIs) occur within 48 hours of entering a healthcare setting such as a hospital. HCAIs are entirely preventable forms of diseases.
Aims: This research aims to determine the rates and trends of HCAIs in Ireland and the associated use of antimicrobials.
Methods: A detailed review of the available data on HCAIs and antimicrobial prescriptions in Ireland was conducted. Data were organized and correlated to determine the rates of HCAI and AMR in Ireland and analyze any significant trends over time.
Conclusions: Overall multidrug resistance (MDR) rates are increasing in pathogens such as Escherichia coli and Klebsiella pneumonia, which must be monitored and tackled. It is critical that targets set in the recently published 'National Action Plan on Antimicrobial Resistance' are met and that a holistic approach to combatting the global healthcare threat of MDR is taken.
Keywords: Antibiotic prescription · Antimicrobial resistance · Drug resistance · Healthcare-associated infection · Nosocomial infection
Introduction
Healthcare-associated infections (HCAIs), or nosocomial infections, refer to diseases that occur due to contact with the healthcare system, from primary care to nursing homes to hospital settings [1]. HCAIs are infections that develop in patients 48 hours or more after admission to the healthcare setting. Diseases occurring within 48 hours from access are considered to have been picked up in the community and are not deemed HCAIs. Some of the most commonly diagnosed types of HCAIs are surgical site infection (SSI), respiratory tract infections, urinary tract infections (UTIs), bloodstream or circulatory system infections, and gastrointestinal infections. According to the HSE, the 5 most common HCAIs in Ireland in 2017 were pneumonia (28.9 %), SSIs (18 %), UTIs (14.5 %), bloodstream infection (BSI) (9.9 %), and gastroenteritis (3.5 %) [2]. In Europe, approximately 8.9 million HCAIs are estimated to occur yearly in European hospitals and long-term care facilities. Despite the large number of HCAIs seen annually across various geographies, more than half of all certain HCAIs are preventable.
According to a recent review of 144 studies, up to 55% of HCAIs could be eliminated by systematically implementing evidence-based infection prevention and control strategies, regardless of the country's economic status [3]. In the US alone, it is estimated that 50-70 % of the 2 million HCAIs reported by the Centre for Disease Control can be attributed to indwelling medical devices [4]. While HCAIs can be caused by many different bacterial species, many bacteria species show signs of antimicrobial resistance (AMR) (see Figure 1). AMR accounts for 4.95 million deaths worldwide yearly [5], and the AMR bacterial strains responsible are increasing in HCAIs in Irish healthcare settings [6].
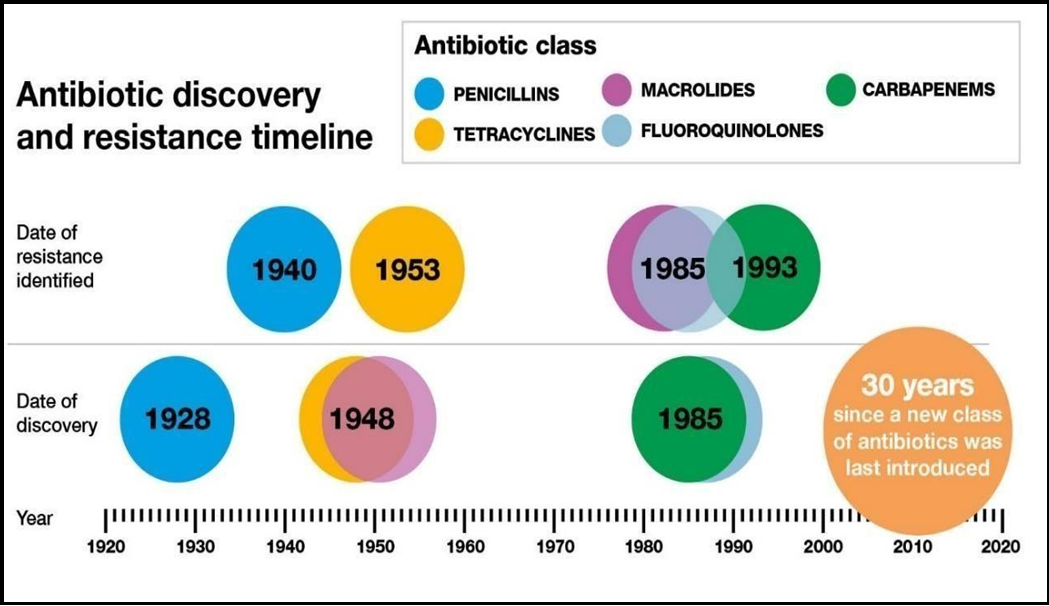
Figure 1: Above shows the time of discovery and when resistance was first developed to some of the antibiotic classes listed. This is the first class of antibiotics introduced in the last 30 years due to the time and costs involved in bringing a new antibiotic to the market [7].
An HCAI may be caused by the patient's microorganisms (endogenous infection) or can be due to microorganisms from the healthcare environment (exogenous/cross infection) [8]. HCAIs are entirely preventable given that proper facilities and equipment are available and that healthcare staff uses the appropriate aseptic techniques and infection control management systems to prevent infections. While correct patient management is critical to avoiding HCAIs, other factors, such as the devices used in many of these procedures, can act as a source for pathogenic bacteria to proliferate. Data on device-related HCAIs published by the HPSC for 2012 and 2017 show a strong link between acquiring an infection in a hospital setting and the prolonged use of medical devices [2,9].
Various measures have been brought in to prevent HCAIs, such as infection prevention and control, surveillance of HCAIs at a local and national level, and improved microbiology laboratory support in hospitals and especially in long-term care facilities [10].
The following section aims to determine the most prevalent HCAIs affecting patients and their associated pathogens. This is to inform the research direction of the Ph.D. in terms of which devices to study and which pathogens to test material against.
Background
1.1 HCAI Types
1.1.1 Pneumonia
Pneumonia is an infection of the respiratory system that causes inflammation within the lungs' alveoli. Viruses, bacteria, and fungi can all cause various presentations of pneumonia. Hospital-acquired pneumonia can be one of the hardest-to-treat forms of the condition as the bacteria causing the infection may be resistant to antibiotics, and the patient has often already been treated with antibiotics for another condition; further prescription of them puts excessive strain on the patient [11]. Hospital-acquired pneumonia can be spread by healthcare staff who can pass on the pathogen from their hands, clothes, or instruments.
Pneumonia accounted for 28.9 % of all HCAIs reported in the Republic of Ireland in 2017, making it the most prevalent HCAI in the country that year [2]. An ECDC surveillance report documented that 97.4 % of reported cases of pneumonia were associated with intubation procedures in an intensive care unit (ICU) setting. The prevalence of at least one episode of pneumonia amongst patients staying in an ICU for more than two days was 6.4% [12].
1.1.2 Surgical Site Infection
A surgical site infection (SSI) occurs when the body part where the surgery occurred becomes infected. They can be classed depending on the area of the body where the surgery took place into superficial incisional SSI, deep incisional SSI, and organ space SSI [13]. Superficial incisional SSI occurs at the incisional site for minor surgeries. The site can often become infected through direct invasion of the bacterial flora present generally on the skin entering the wound. Risk factors for developing an SSI are based on host factors, such as obesity, age, malnutrition, hyperglycemia, microbial factors, and surgical/environmental factors [14].
SSI development places a substantial financial burden on the healthcare system due to extended hospitalizations, additional diagnostic tests and treatments, and sometimes further surgeries. Complications to the patient include pain, anxiety, delayed wound healing, and susceptibility to secondary infections [13]. Staphylococcus aureus is the most common pathogen identified in SSI [15,16]. Surgical site infections comprised 18.0% of all HCAI infections reported in Ireland in 2017, making it the second most common HCAI that year [17].
1.1.3 Urinary Tract Infection
Urinary catheters are associated with the majority of urinary HCAIs. Catheter-associated urinary tract infections (CAUTIs) are among the most prevalent HCAIs. Irish data from 2017 shows that UTIs made up 14.5 % of all HCAIs reported that year, making it the third most common HCAI said that year. CAUTIs accounted for 33% of all UTIs in Irish ICUs that year [12].
According to the European Centre for Disease Prevention and Control, urinary catheters were used in 81% of patient days in an intensive care unit (ICU), with 97.4 % of UTI episodes associated with using a urinary catheter [12]. CAUTI development in ICU increases the length of hospital stay and possible mortality rate, increases costs, and results in the overuse of antibiotics [18]. Of bloodstream infections (BSI) reported, those secondary to a UTI represent 16.6 % of all cases [12]. Despite being one of the most prevalent HCAIs globally, it is also the cheapest HCAI to remedy, as the primary method of UTI or CAUTI treatment is antibiotic prescription [19]. Although the most affordable to fix, there are serious concerns that as antibiotic resistance continues to increase each year, other appropriate therapies need to be developed quickly [17].
In a meta-analysis examining antimicrobial resistance to CAUTI, which pooled data from 75 studies across regions globally, it was recorded that Candida spp (27.4 %) was the most frequent pathogen group to cause (CAUTI), followed by Escherichia spp (23.41 %) and Enterococcus spp (15.0 %). The most common fungi identified were resistant to the antifungal agent itraconazole. Escherichia spp and Enterococcus spp displayed high rates of resistance to antibiotics (between 71.2 % to 87.3 % resistance) [18].
1.1.4 Bloodstream Infection
A bloodstream infection (BSI) is an infectious disease in which microorganisms in the bloodstream elicit an inflammatory immune response (20). Although the source of microorganisms responsible for BSIs can be diverse, ranging from the urinary tract, gastrointestinal tract, surgical site, or skin, BSIs are often associated with intravascular access devices, such as central lines [21]. European Centre for Disease Prevention and Control (ECDC) data shows that 37% of all BSI infections were catheter-related. The most frequently isolated microorganism in BSIs found in ICUs across Europe 2017 was Coagulase-negative staphylococci at 23.6 % of all cases. This was followed by Enterococcus species (including Enterococcus faecalis and Enterococcus faecium), Klebsiella species, Staphylococcus aureus, Pseudomonas aeruginosa, Escherichia coli, Enterobacter species, and Acinetobacter species reported as 14.9 %, 12.4 %, 12.0 %, 9.5 %, 9.2 %, 8.3 % and 2.3 % respectively [22].
1.1.5 Gastroenteritis
Gastroenteritis is a gut infection caused by both bacterial and viral microbes. Norovirus or adenovirus infections are responsible for most presentations of this illness in the UK and Ireland (23). 3.5% of all HCAIs reported by the health service in Ireland in 2017 were gastroenteritis, making it the 5th most common HCAI in the country that year [2]. Several species of bacteria can cause different disease symptoms, such as nausea, vomiting, diarrhea, and fever. Bacterial species such as Campylobacter, Salmonella, E. coli, and C. Difficile can all cause various forms of gastroenteritis.
1.2 HCAI Causative Organisms
The list of causative organisms below is incomplete and covers the majority of related HCAIs.
1.2.1 Staphylococcus Aureus
S. aureus is found on the skin and mucous membranes of healthy individuals. The most common cause of an S. aureus infection is skin and soft tissue infections of non-surgical wounds, accounting for 20 % of all S. aureus notifications in 2017. 15 % of S. aureus bloodstream infections are associated with device usage, such as central or intravenous line catheters [24]. 21 % of Methicillin- resistant S. aureus (MRSA) cases in Ireland are found in non-surgical wound infections, the primary source in the 2017 data, with 56 % flagged as having been acquired in a healthcare setting. A similarly high figure of 57% for MRSA being caught in a healthcare setting was observed in 2018 [25].
While the reported MRSA rate has been reducing year on year in Ireland since 2011, it still accounts for 0.03 per 1000 patient bed days as of 2019 (24). Despite the reduction from 0.043 cases per 1000 bed day used (BDU) in 2017 and 0.035 cases per 1000 BDU in 2018, MRSA is still a significant problem in Irish hospitals, with Ireland reporting one of the highest proportions of MRSA in Northern and Western Europe in 2018.
The number of invasive S. aureus infections increased by 10% between 2014-2018 in Ireland, with 55 % of all S. aureus infections reported as being acquired in a healthcare setting in 2017 and similar figures reported in 2018 and 2019 [24,25].
1.2.2 Escherichia coli
E. coli is the most common causative pathogen for UTI and CAUTI. On average, E. coli is the primary causative organism for infection in more than 50% of all UTI cases (43 % of all E. coli cases were found in the urinary tract without catheter use) [25,26].
Ireland has Europe's highest Verotoxigenic Escherichia coli (VTEC) notification rate and the lowest proportion of fully susceptible E. coli notifications in 2018 [25]. While the European Union's average notification rate for confirmed VTEC cases was 1.66 per 100,000 population in 2017, Ireland reported rates of 16.6 per 100,000, 10 times the European average [26]. In the most recent data available, Ireland continues to write the highest rate of VTEC in Europe through 2020, with speed that year climbing to 17.3 cases per 100,000 population [27].
The number of invasive E. coli infections increased by 20 % between 2014-2018 in Ireland, with 39 % reported as being acquired in a healthcare setting in 2017, with similar figures reported in 2018 and 2019 [24].
1.2.3 Enterococci (Enterococcus faecium, Enterococcus faecalis)
Enterococcus bacteria reside in the normal gut flora of healthy individuals, though they can cause infections in seriously ill or immunocompromised individuals. This bacterium is naturally resistant to many antimicrobials; however, vancomycin is used to treat infections. The primary source of enterococcus bloodstream infection is the intra-abdominal and gastrointestinal tract, accounting for 10% of all cases observed. A rise in vancomycin resistance has been scanned and is concerning [25]. 72 % of all enterococci isolates in 2017 were reported to be hospital-acquired [24].
This bacterial species can be further classified into Enterococcus faecium and Enterococcus faecalis. Ireland in 2018 was one of only two European countries where the number of Enterococcus faecium reported (419 cases) was higher than that of Enterococcus faecalis (332 points). This is a 5 % decrease in E. faecium numbers on the 2017 figure of 442 and a 2 % decrease in the number of E. faecalis reported in 2017 of 340 [24]. Ireland has one of Europe's highest proportions of vancomycin-resistant E. faecium (VREfm), rating third after just Cyprus and Romania. VREfm accounted for 40.2 % of isolates here in 2018, up from 38.2 % in 2017. 71% of E faecium and 81 % of VREfm were reported to have been acquired in a hospital setting in 2019, down from 77 % and 86% in the previous year [2,24].
E. faecalis is less burden on the Irish health care system than its relative E. faecium. 44 % of all E. faecalis cases were reported to have been hospital-acquired in 2019, down one percentage point from the previous year (28). The rate of vancomycin-resistant E. faecalis (VREfa) in Ireland is meager, reaching 0.6 % in 2018.
Overall, 92 % of VRE cases (VREfm and VREfa) were reported in 2018 to have been acquired in the hospital, defined as any case isolated three or more days after admission.
1.2.4 Klebsiella pneumoniae
Klebsiella pneumoniae resides in the normal gut flora of healthy individuals. However, it can cause pneumonia, wound infections, urinary tract infections, and bloodstream infections in seriously ill or immunocompromised individuals. The most common source of K. pneumoniae bloodstream infections is urinary tract infections, accounting for 24 % of all K. pneumoniae bloodstream infections in 2018. 5 % of K. pneumoniae infections were reported as being associated with catheter usage in 2018 [25].
Case numbers of K. pneumoniae have remained stable in the last two full years of reporting, with 479 cases reported in 2017 and 483 points in 2018, although this 2018 figure is up 36 % since 2014 [24,25]. The K. pneumoniae bacterium is naturally resistant to aminopenicillins, and the number of isolates that are showing resistance to multiple other antibiotics is on the rise, with it reaching its highest rate in 2018 since records began with a multi-drug resistance rate of 8.3 % being reported [25].
Most K. pneumoniae infections are healthcare-associated, with 59 % of all K. pneumoniae bloodstream infections 2018 being classed as hospital-acquired, up slightly on the 2017 figure of 54 % [24] [25].
1.2.5 Streptococcus pneumoniae
Streptococcus pneumonia resides in the upper respiratory tract flora and is the leading cause of community-acquired pneumonia. It can also be associated with invasive infections such as bloodstream infections and meningitis. The most common source of pneumococcal bloodstream infections is a respiratory tract infection.
455 cases of invasive S. pneumoniae infection were reported in 2018, up 10 % from the 2017 figure of 412 points. Penicillin is the treatment of choice for S. pneumoniae infections, although penicillin-resistant S. pneumonia infections are on the rise. These penicillin non- susceptible S. pneumoniae isolates (PNSP) accounted for 20.7 % of all S. pneumoniae isolates in 2018, up from 15.8 % in the previous year. Ireland has moderately high proportions of PNSP isolates compared to other EU countries, and though the rate has fluctuated since 2014, the rate has increased by 50 % between 2015 and the last full year reported in 2018 and is 2018 at its highest level in a decade with a rate of 21 % PNSP reported. The half-year data report 2019 shows a promising decrease to 13 %, although Q1 and Q2 data do not adequately represent Q3 and Q4 data, where colder weather sees an increase in autumnal and winter illness in Ireland, such as that associated with S. pneumoniae. Multi-drug resistant S. pneumoniae, which is resistant to both penicillin and erythromycin, was reported to be 9.1 % in 2018, up from 2017’s figure of 8.6 %, although a downward trend in isolates showing a high-level resistance to penicillin has been observed between 2011-2018, dropping from a rate of 6 % to just over 1 %.
The vast majority of S. pneumoniae invasive infections are acquired in the community, with 96 % of all cases reported in 2018 being isolated within two days of hospital admission, leaving just 4% of patients in 2018 being deemed hospital-acquired, down from 10% the previous year [24, 25].
1.2.6 Pseudomonas aeruginosa
Pseudomonas aeruginosa is widely found in the environment and thrives on medical devices such as catheters and ventilators. P. aeruginosa causes pneumonia, urinary tract and bloodstream infections in immunocompromised individuals. The most common source of P. aeruginosa bloodstream infections is urinary tract infections, accounting for 18 % of all P. aeruginosa bloodstream infections in 2018, a slight decrease from 2017’s figure of 26 %. 8 % of all P. aeruginosa infections were linked to urinary catheter use in 2018. 273 cases of invasive P. aeruginosa infection were reported in 2018, a slight 5 % decrease from the 288 cases reported in 2017 but an overall increase of 54 % in cases since 2015 [25].
P. aeruginosa is inherently resistant to many antimicrobials, so further resistance to any antimicrobials to which it is currentl susceptible can seriously compromise patient treatment options. Antimicrobial-resistant isolates of P. aeruginosa in Ireland were at moderately low levels in 2018 compared with other European countries. The rate of isolates showing resistance to three or more antimicrobials in 2018 was just 3.1 %, a significant decrease over the 2017 and 2016 figures of 8.5 % and 8.6 %, respectively. However, the half-year data to the end of Quarter 2 2019 shows the rate has increased again to 7.9 % [9,24].
In 2018, 65 % of invasive P. aeruginosa bloodstream infections were healthcare related, down slightly from the 68% reported in 2017 [24].
1.2.7 Acinetobacter species
Acinetobacter species are widely found in the environment and thrive on medical devices such as catheters and ventilators. Acinetobacter spp. causes pneumonia, urinary tract and bloodstream infections in immunocompromised individuals. 62 cases of bloodstream infection due to Acinetobacter spp. in 2018, down slightly from the 66 reported in 2017 [25].
This bacterium is inherently resistant to many antimicrobials, so further resistance to any antimicrobials to which it is currently susceptible can seriously compromise patient treatment options. However, the antimicrobial resistance of Acinetobacter spp. in Ireland remains low at less than 1 %, compared to other EU countries where rates go above 25%. No isolates were identified in Ireland 2018 that showed Resistance to three or more antimicrobials [25].
32 % of cases identified were isolated more than two days after hospital admission, with these cases highly likely to have been acquired within the hospital setting.
1.3 Antimicrobial Resistance in the Republic of Ireland
Antimicrobial Resistance occurs when bacteria, viruses, fungi, and parasites change over time and no longer respond to antimicrobial drugs - including antibiotics, antivirals, antifungals, and antiparasitics - making infections harder to treat, and increasing the risk of disease spread, severe illness, and death. As a result of drug resistance, antimicrobial medicines become ineffective, and infections become increasingly difficult or impossible to treat. For this reason, the World Health Organisation (WHO) has declared that AMR is a global health threat and one of the top 10 global public health threats facing humanity [29].
This introduction detailed the most prevalent HCAIs as pneumonia, catheter-associated urinary tract infection (CAUTI), and surgical site infection (SSI) due primarily to the bacterial species Streptococcus pneumonia, Pseudomonas aeruginosa, Acinetobacter species, Staphylococcus Aureus, Klebsiella pneumoniae, Escherichia coli and Escherichia spp and Enterococcus spp. Antimicrobial Resistance poses a severe threat to healthcare and the treatment of HCAIs. To get a clearer picture of the trends in HCAI prevalence and AMR in Ireland, this chapter aims to comprehensively review HCAI and AMR majority in Ireland and analyze data to determine trends.
2. Methods
A comprehensive review of available literature on HCAIs and antimicrobial resistance (AMR) in the Republic of Ireland was conducted from 2012-2019. A comparison of the trends seen in Europe was examined to determine if the Republic of Ireland had similar levels of HCAI and AMR as their European counterparts.
Specifically, the types of HCAIs examined were pneumonia, surgical site infections, urinary tract infections, bloodstream infections, and gastroenteritis, for their incident rate and trend from 2012-2019. The bacterial strains examined as part of this research were Escherichia coli, Staphylococcus aureus, Enterococcus faecium, Enterococcus faecalis, Klebsiella pneumoniae, Streptococcus pneumoniae, Pseudomonas aeruginosa, Acinetobacter species for their incident rate and trend from the years 2012-2019. Up-to-date data on HCAIs and AMR in the Republic of Ireland was unavailable from Quarter 3 of 2019 onwards.
Keyword search terms, including healthcare-acquired infection, nosocomial infection, antimicrobial resistance, drug resistance, and antibiotic prescription, were used across the online databases Google Scholar, ScienceDirect, and PubMed. The Central Statistics Office (CSO) and HSE databases were searched using the term hospital infections, and the resulting Irish-specific data was assessed.
3. Results
3.1 Rates and Types of HCAIs Reported in the Republic of Ireland
In a recent analysis carried out by the HPSC, it was found that of the 10,333 patients surveyed, 633 of them had an HCAI at the time of the study, equating to an HCAI rate of 6.13 % in May 2017 (see Table 1) [2]. An earlier study performed by the same group in 2012 showed that from the 9,030 eligible patients surveyed, 5.17 % experienced an HCAI when the survey was conducted [9].
This represents an increase of 18.57 % in 2017 on the 2012 figures. This is a statistically significant result, as measured by the Chi-square test of independence (p < .05).
Both of these studies were conducted using data provided by public and private acute hospitals nationwide. In 2012, 50 hospitals participated in the survey; 42 public hospitals and 8 private hospitals provided data from their intensive care units (ICUs) and wards. The 2017 study took the same approach, collecting and analyzing data from acute hospitals in Ireland. In 2017, 22 public and 7 private hospitals participated in the study by providing the HPSC data from their ICUs and wards.
As seen in (Table 1), the overall incidence rate of one or more HCAIs rose in numeric terms by 0.96 %. The incidence rate of a single HCAI rose most sharply, a 19.1 % rise on the 2012 figure. While the incidence rate of two concurrent HCAIs remained stable, the incidence rate of three HCAIs quadrupled from 1 in 2012 to 4 in 2017. While only making up a small percentage of all HCAIs documented in the study, this rise of multiple concurrent HCAIs is noteworthy due to the massive 300 % year-on-year rise; however, with a low number of cases for both years, it is difficult to ascertain if this result is meaningful.
Table 1: Rates of HCAI reported in the Republic of Ireland between 2012 – 2017. %Δ denotes the percentage change between 2012 and 2017 as a proportion of the 2012 figure (Source Data [30]).
|
|
2012 |
2017 |
|
||
|
No of HCAI per Patient |
Patients (N) |
Patients (%) |
Patients (N) |
Patients (%) |
%Δ |
|
0 |
8,563 |
94.83 % |
9,700 |
93.87 % |
-1.01 % |
|
1 |
434 |
4.81 % |
592 |
5.73 % |
+19.13 % |
|
2 |
32 |
0.35 % |
37 |
0.36 % |
+2.86 % |
|
3 |
1 |
0.01 % |
4 |
0.04 % |
+300.00 % |
|
Total |
9,030 |
100 % |
10,333 |
100 % |
|
|
HCAI Rate |
5.17 % |
6.13 % |
+18.57 % |
||
The most frequent type of HCAIs reported were Surgical Site Infections, Pneumonia, Urinary Tract infections, Bloodstream infections, Gastrointestinal system infections, and systemic infections (see Table 2). These six infection types represent 80% of all HCAIs reported in 2012 and 2017. The remaining 11 types of HACIs represent just 20% of HCAIs reported.
Table 2 shows the percent change between 2012 and 2017 for each infectiontype. (see Table 2).
The final column in Table 2 also highlights some decreases in HCAI rates between the two reported years. Reproductive tract infections can be seen to have decreased by 71.4 % to make up only 0.4 % of infections in 2017, and catheter-related infections are reported to have reduced by 70.0 % to 0.3 % in 2017. There was a statistically significant decrease in bone and joint infections by 65.8 % to 1.3 % in 2017.
There was also a statistically significant decrease in gastrointestinal system infections by 64.3 % to 3.5 % in 2017, as measured by the Chi-square test of independence (p < .05). While these decreases in HCAI incidence rates are welcome, it is worth highlighting again from Table 1 that the overall rate of HCAI incidence increased by 18.6 % in this period between 2012 and 2017.
As can be seen in Figure 2, there was a statistically significant increase (68 %) in pneumonia infections between 2012 and 2017, as measured by the Chi-square test of independence (p < .05). There were also increases noted in the skin and soft tissue infections, lower respiratory tract infections and cardiovascular system infections, with all other infection types decreasing in the 5 years.
Although the number of cardiovascular systems infections is relatively low, there is a 150 % increase between 2012 and 2017 in this infection type. The most significant decreases observed between 2012 and 2017 were in reproductive tract infections and catheter- related infections, seeing declines of 71.4% and 70.0%, respectively. However, due to the low incidence, it is impossible to calculate statistical significance. There were statistically significant decreases in bone and joint infections, gastrointestinal system infections, and neonatal infections, 65.8% and 64.3%, and 57.1%, respectively, over their 2012 figures (see Figure 2).
Table 2: Summary of the types of HCAIs reported in the Irish healthcare sector in 2012 and 2017 [8,2]. %Δ denotes the percentage change between 2012 and 2017 as a proportion of the 2012 figure. * Represents statistical significance by Chi-square test of independence (P<0.05). Statistical significance could not be calculated for infection types with incidence (N) less than 7.
|
|
2012 |
2017 |
|
||
|
HCAI Infection Site |
N |
% |
N |
% |
%Δ |
|
Surgical site infection |
91 |
18.2 % |
122 |
18.0 % |
-1.1 % |
|
Pneumonia |
86 |
17.2 % |
196 |
28.9 % |
+68.0 %* |
|
Urinary tract infection |
75 |
15.0 % |
98 |
14.5 % |
-3.3 % |
|
Bloodstream infections |
66 |
13.2 % |
67 |
9.9 % |
-25.0 % |
|
Gastrointestinal system infections |
49 |
9.8 % |
24 |
3.5 % |
-64.3 %* |
|
Systemic infections |
38 |
7.6 % |
42 |
6.2 % |
-18.4 % |
|
Eye, ear, nose, throat or mouth infections |
23 |
4.6 % |
24 |
3.5 % |
-23.9 % |
|
Bone & joint infections |
19 |
3.8 % |
9 |
1.3 % |
-65.8 %* |
|
Skin and soft tissue infections |
16 |
3.1 % |
26 |
3.8 % |
+22.6 % |
|
Neonatal specific infections |
14 |
2.8 % |
8 |
1.2 % |
-57.1 %* |
|
Reproductive tract infections |
7 |
1.4 % |
3 |
0.4 % |
-71.4 % |
|
Lower respiratory tract infections |
7 |
1.4 % |
16 |
2.4 % |
+71.4 % |
|
Catheter-related infections |
5 |
1.0 % |
2 |
0.3 % |
-70.0 % |
|
Central nervous system infections |
3 |
0.6 % |
3 |
0.4 % |
-33.3 % |
|
Cardiovascular system infections |
2 |
0.4 % |
7 |
1.0 % |
+150.0 % |
|
C. difficile infection (CDI) |
n/a |
n/a |
30 |
4.4 % |
- |
|
Unknown |
n/a |
n/a |
1 |
1% |
- |
|
Total |
501 |
100% |
678 |
100% |
|

Figure 2: Percentage difference in HCAI infection types between 2012 and 2017 in the Republic of Ireland hospital settings.
3.2 Rates of Antimicrobial Prescriptions Reported in the Republic of Ireland
(Table 3) documents the use of antimicrobials in the Irish healthcare system. The increase of 21.8 % in the number of patients prescribed 1 antibiotic from 2012 to 2017 is statistically significant as measured by the Chi-square test of independence X2 (p < .05). There are no other significant differences in the prescription of 2 or more antimicrobials per patient between these years. This same HPSC data in Table 3 found that in 2017, 4,105 patients of the 10,333 surveyed were currently being prescribed antimicrobial drugs (39.7 %). Thus, approximately four-in-ten patients admitted to Irish hospitals in 2017 were prescribed antibiotics. An earlier study conducted in 2012 by the same group demonstrated that 3,108 patients of the 9,030 surveyed were being prescribed antimicrobials at the time of the study (34.4 %) (see Table 3). A Chi-square test of independence shows that the 15.4% increase in antibiotic prescriptions reported between 2012 and 2017 is statistically significant (p < .05).
Table 3: Summary of antibiotic prescriptions within the Irish hospital setting and the number of antibiotics prescribed per patient at the time of the survey. %Δ denotes the percentage change between 2012 and 2017 as a proportion of the 2012 figure. Note: 5,813 antimicrobials were prescribed (5,580 antibacterials and 233 antifungals) [2]. * Represents statistical significance by Chi-square test of independence (P < 0.05).
|
Year |
2012 |
2017 |
|
||
|
No of Antimicrobials Prescribed per Patient |
Patients (N) |
Patients (%) |
Patients (N) |
Patients (%) |
%Δ |
|
0 |
5,922 |
65.6 % |
6,228 |
60.3 % |
-8.1 % |
|
1 |
1,991 |
22.0 % |
2,771 |
26.8 % |
+21.8 %* |
|
2 |
894 |
9.9 % |
1,058 |
10.2 % |
+3.0 % |
|
3 |
158 |
1.8 % |
205 |
2.0 % |
+11.1 % |
|
4 |
46 |
0.5 % |
51 |
0.5 % |
0 % |
|
5 |
19 |
0.2 % |
20 |
0.2 % |
0 % |
|
Total |
9,030 |
100 % |
10,333 |
100 % |
|
|
1 or more |
3,108 |
34.4 % |
4,105 |
39.7 % |
+15.4 %* |
Table 4: shows a consistent usage of antimicrobials in the community and hospital sector between 2012 and 2017. The data is presented in daily defined doses, determined by the WHO in 2011 as the assumed average maintenance dose per day for a drug used for its main indication in adults [30]. Although there was a notable drop in the overall combined community and hospital daily defined dose between the years 2019 and 2020, this, in part, may have been due to the reduced number of patients who were able to present to a healthcare setting due to the restrictions put in place nationwide to curb the spread of COVID-19 in early 2020. The decrease seen in 2020 is not defined as a statistical outlier (z=2.2, P >.05).
Table 4: shows that the majority of antimicrobial prescription and use is happening in the community; in 2020, 92 % of all antimicrobial use recorded in the country occurred in the community. The data shows a consistent community consumption of antimicrobials for systemic use from 2012-2019. A notable drop is also seen in antimicrobial use in the community in 2020, although it does not represent a statistical outlier (z=2.248, P >.05). The data also shows a consistent consumption of antimicrobials for systemic use within the hospital sector from 2012-2019.
A notable drop is seen again in 2020 for prescribing antimicrobial drugs in a hospital setting, although it does not represent a statistical outlier (z=1.412, P>.05).
Table 4: Total consumption of antimicrobials for systemic use from 2012-2020 in the Republic of Ireland for the community, hospital, and combined community & hospital. Data expressed as Daily Defined Dose (DDD) per 1,000 inhabitants per day.
|
Daily Defined Doses (DDD) |
2012 |
2013 |
2014 |
2015 |
2016 |
2017 |
2018 |
2019 |
2020 |
|
Community & Hospital |
21.0 |
21.6 |
21.0 |
23.0 |
22.0 |
20.9 |
22.4 |
22.8 |
18.6 |
|
Community |
19.5 |
20.0 |
19.5 |
21.3 |
20.4 |
19.3 |
20.7 |
21.0 |
17.1 |
|
Hospital |
1.58 |
1.59 |
1.48 |
1.71 |
1.66 |
1.60 |
1.78 |
1.77 |
1.47 |
3.3 Rates of Antimicrobial Resistance in the Republic of Ireland
Misuse and overuse of antimicrobials are the main drivers in developing drug-resistant pathogens. Although there are some correlations observed that show decreasing incidence rates of Fluoroquinolone resistant E. coli over time, reducing MRSA and VRE resistance over time (see Table 5), none of these correlations are statistically significant (Pearson’s correlation test, P >.05) but point to decreasing incidence-.
Table 5: Summary of antimicrobial resistance in Irish hospital setting between 2015 – 2019. The total number of isolates tested positive for each bacterial species followed by the number of isolates showing specific antimicrobial resistance and the proportion of the total positive isolates for said bacterial species these AMR isolates account for (in brackets).
%Δ denotes the percentage change between 2015 and 2019 as a proportion of the 2015 figure [31].
|
|
2015 |
2016 |
2017 |
2018 |
2019 |
%Δ |
|
Escherichia Coli (Fluoroquinolone Resistant) |
2631 (23.1 %) |
2990 (22.9 %) |
3119 (23.6 %) |
3238 (23.9 %) |
3233 (20.4 %) |
-11.7 % |
|
Staphylococcus Aureus (Methicillin Resistant (MRSA) |
1057 (18.1 %) |
1143 (14.3 %) |
1140 (16.3 %) |
1188 (12.4 %) |
1146 (12.6 %) |
-30.4 % |
|
Enterococcus faecium (Vancomycin Resistant (VRE)) |
404 (45.8 %) |
422 (44.1 %) |
442 (38.2 %) |
418 (40.2 %) |
443 (38.4 %) |
-16.2 % |
|
Enterococcus Faecalis (Vancomycin Resistant (VRE)) |
292 (28.0 %) |
290 (29.4 %) |
340 (30.8 %) |
332 (23.6 %) |
301 (23.0 %) |
-17.9 % |
|
Streptococcus pneumoniae (Penicillin Resistant) |
303 (17.5 %) |
363 (16.5 %) |
412 (15.8 %) |
455 (20.7 %) |
348 (14.4 %) |
-17.7 % |
|
Klebsiella Pneumoniae (Fluoroquinolone Resistant) |
388 (17.0 %) |
453 (11.3 %) |
478 (14.9 %) |
483 (18.0 %) |
526 (17.3 %) |
+1.8 % |
3.4 Trends in Staphylococcus Aureus-Based Infections
The data in (Table 6) shows that while the incidence of S. aureus in isolates is rising year-on-year, the rate of MRSA positivity is decreasing. In 2017, 15 % of S. aureus infections were reported as device-associated BSI. The data below shows that there is a statistically significant increasing trend in S. aureus infection incidence rate per 1000 patients bed days used over time from 2012- 2018 (Pearson’s correlation, n=7, P <.05). There is a statistically significant decreasing trend in percentage MRSA positive isolates between 2012-2018 (Pearson’s Correlation, n=7, P <0.05). Balancing this, there is a statistically significant increasing trend in the percentage of MSSA isolates between 2012 and 2018 (Pearson’s correlation, n=7, P <.05). Note that this statistical result concerning MRSA slightly differs from that presented in Table 5. Table 5 data is gathered from the ECDC and varies somewhat from the HSE data presented in Table 6. However, both datasets show the same trend in Figure 3. MSSA is not resistant to methicillin-type drugs, the prominent family of medications used to treat S. Aureus infections, and as such, its increase is not a significant concern for the healthcare system in Ireland. The percentage of all S. aureus isolates reported as MRSA can be seen in the graph as a line with a downward trend for the period in question from 22.5 % in 2012 to 12.6 % in 2019, or a significant 44% drop between the two years (see Figure 3).
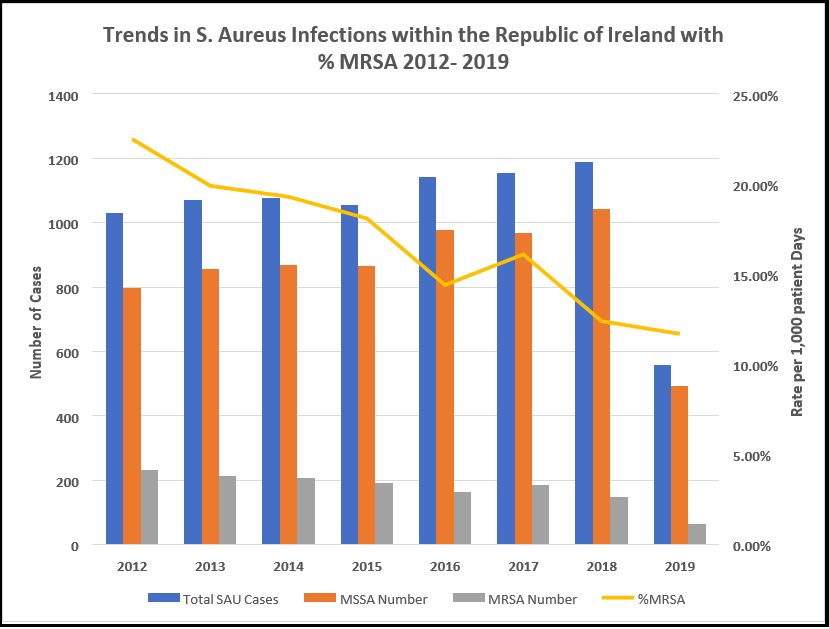
Figure 3: Trends of S. aureus infections within the Republic of Ireland in acute hospital (public and private) settings between 2012-2019.
Table 6: Summary of S. aureus data for the Republic of Ireland between 2012-2019. The only data collected for antibiotic resistance is methicillin.
%Δ denotes the percentage change between 2012 and 2018 as a proportion of the 2012 figure. # Indicates figures for which only half year data for Q1 and Q2 was available [28].
|
Year |
2012 |
2013 |
2014 |
2015 |
2016 |
2017 |
2018 |
2019 |
%Δ |
|
Total Number of S. Aureus Positive Isolates |
1030 |
1070 |
1076 |
1056 |
1142 |
1155 |
1188 |
557# |
+15.3 % |
|
S. aureus rate per 1,000 bed days used |
0.262 |
0.269 |
0.268 |
0.266 |
0.281 |
0.271 |
0.280 |
0.261# |
+6.9 % |
|
Number MSSA Positive Isolates (% of Total) |
798 (77.5 %) |
857 (80.1 %) |
868 (80.7 %) |
865 (81.9 %) |
978 (85.6 %) |
969 (83.9 %) |
1041 (87.6 %) |
492# (88.3 %) |
+30.5 % |
|
Number MRSA Positive Isolates (% of Total) |
232 (22.5 %) |
213 (19.9 %) |
208 (19.3 %) |
191 (18.1 %) |
164 (14.4 %) |
186 (16.1 %) |
147 (12.4 %) |
65# (11.7 %) |
-36.6 % |
3.5 Trends in Escherichia Coli-Based Infections
There is an increase in isolates testing positive for E. coli in Ireland between 2014 and 2019 (see Figure 4). In 2017, 4% of E. coli infections were reported as device-associated BSI. There are some moderate correlations between increasing E. coli isolate resistance over time for Piperacillin/tazobactam-R and Cefoxitin over time between 2014-2018 (2012 & 2013 were not included as there was no historical data available for these time points, and 2019 data was not included as it only represents the first half of the year). However, these correlations are not statistically significant (see Figure 4).
There are significant increases in isolate resistance over time from 2014-2018 for Amoxicillin-clavulanic acid-R, 3GC-R, Cefotaxime/ceftriaxone-R, Ceftazidime-R and ESBL-producers (Pearson’s correlation, n=5, P <.05). This is also reflected in a statistically significant increasing trend in the number of isolates over the 5 years (Pearson’s correlation, n=5, P <.05).
Overall, there is a statistically significant increasing trend in percentage multidrug resistance over the 5 years (Pearson’s correlation, n=5, P <.05), and this trend continues for the first half of 2019 (see Figure 4).
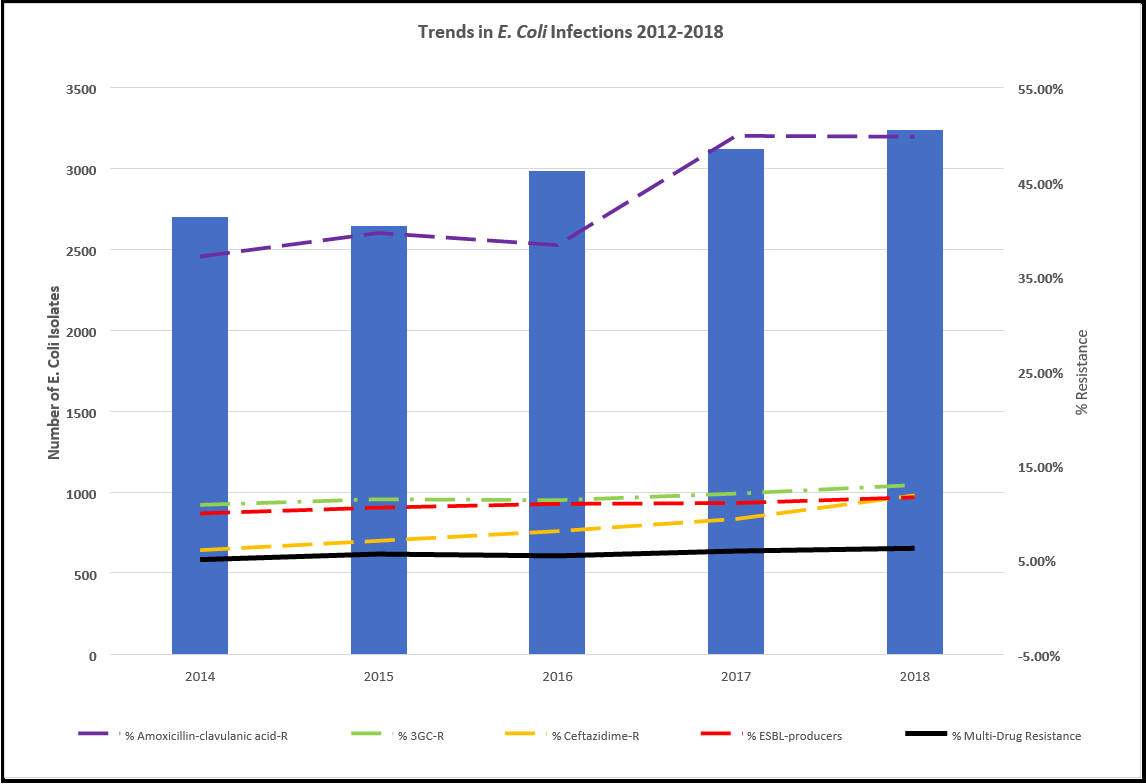
Figure 4: Trends in E. coli infections and rates of resistance for each antibiotic, which showed significant changes in the seven years from 2012- 2018 in the Republic of Ireland, and the overall multidrug resistance rate of E. coli isolates for each year.
Table 7: Number of invasive Escherichia coli infections and relative resistance in Ireland. Cases were classified as Multidrug Resistant (MDR) if the isolate was resistant to at least 2 antibiotics. %Δ denotes the percentage change between 2014 and 2018, where full-year data was available, as a proportion of the 2014 figure. Blank spaces indicate data points that were unavailable. -R following an antibiotic stands for resistance. # Indicates figures for which only half-year data for Q1 and Q2 was available. * Represents statistical significance over time from 2014-2018 (or 2014-2019 where full-year data is available) (Pearson’s correlation, P <.05) [6,32-34].
|
Year |
2012 |
2013 |
2014 |
2015 |
2016 |
2017 |
2018 |
2019 |
%Δ |
|
Number of Isolates |
2450 |
2530 |
2702 |
2647 |
2988 |
3124 |
3239 |
1678# |
+19.87 %* |
|
Ampicillin-R |
69.6 % |
70.9 % |
68.9 % |
66.3 % |
68.0 % |
69.5 % |
67.6 % |
67.5 % |
-1.89 % |
|
Amoxicillin-clavulanic acid-R |
|
|
37.1 % |
39.6 % |
38.3 % |
49.9 % |
49.8 % |
51.4 %# |
+34.23 %* |
|
Piperacillin/tazobactam-R |
|
|
11.6 % |
12.0 % |
11.1 % |
14.4 % |
12.6 % |
13.9 %# |
+8.62 % |
|
Cefoxitin-R |
|
|
5.0 % |
5.4 % |
4.3 % |
3.9 % |
6.9 % |
6.9 %# |
+38.00 %* |
|
3GC-R |
10.3 % |
12.3 % |
10.8 % |
11.4 % |
11.3 % |
12.0 % |
12.9 % |
12.1 % |
+19.44 %* |
|
Cefotaxime/Ceftriaxone-R |
|
|
10.7 % |
11.2 % |
11.1 % |
11.8 % |
12.7 % |
11.3 %# |
+18.69 %* |
|
Ceftazidime-R |
|
|
6.0 % |
7.0 % |
8.0 % |
9.3 % |
11.8 % |
8.1 %# |
+96.67 %* |
|
ESBL-producers |
8.8 % |
10.5 % |
9.9 % |
10.5 % |
10.9 % |
11.0 % |
11.6 % |
10.4 %# |
+17.17 %* |
|
Ciprofloxacin-R |
25.2 % |
25.3 % |
24.5 % |
23.1 % |
22.8 % |
23.7 % |
24.1 % |
20.4 % |
-1.63 % |
|
Gentamicin-R |
9.7 % |
9.8 % |
9.9 % |
10.3 % |
9.4 % |
10.1 % |
10.5 % |
11.2 %# |
+6.06 % |
|
Gentamicin/Amikacin/Tobramycin-R |
12.8 % |
12.9 % |
12.4 % |
12.2 % |
11.3 % |
12.1 % |
11.8 % |
11.8 % |
-4.84 % |
|
Carbapenem-R |
0.0 % |
0.1 % |
0.1 % |
0.1 % |
0.1 % |
0.2 % |
0.1 % |
0.0 % |
0.00 % |
|
% Multi-Drug Resistance |
13.6 % |
14.6 % |
5.0 % |
5.6 % |
5.4 % |
5.9 % |
6.2 % |
5.6 % |
+24.00 %* |
3.6 Trends in Klebsiella Pneumoniae
It can be seen from the data in Table 8 that the number of isolates that tested positive for K. pneumoniae has statistically increased year-on- year between 2014 and 2019. In 2017, it was reported that 6 % of K. pneumoniae infections were device-associated BSIs. The trend in increasing resistance of K. pneumoniae to drugs Cefotaxime/ceftriaxone-R and Ceftazidime-R is statistically significant between 2014 and 2019 (Pearson’s correlation, P < 0.05). See Figure 5 for trends over time.
Table 8: Trends in antibiotic resistance to K. pneumoniae in the Republic of Ireland between 2012-2019. %Δ denotes the percentage change between 2014 and 2018 as a proportion of the 2014 figure. Blank spaces indicate data points that were unavailable. # Indicates figures for which only half-year data for Q1 and Q2 was available. *Represents a statistically significant trend between 2014-2018 by Pearson’ Correlation (P < 0.05) [6,28,32,33]
|
|
2012 |
2013 |
2014 |
2015 |
2016 |
2017 |
2018 |
2019 |
%Δ |
|
Number of Isolates |
345 |
326 |
356 |
387 |
453 |
479 |
483 |
527 |
+35.7 % |
|
Ampicillin-R |
98.5 % |
99.1 % |
98.0 % |
98.4 % |
98.7 % |
98.3 % |
98.6 % |
98.8 %# |
+0.8 %* |
|
Amoxicillin-clavulanic acid-R |
|
|
20.4 % |
30.7 % |
24.0 % |
30. % |
29.3 % |
21.4 %# |
+4.9 % |
|
Piperacillin/tazobactam-R |
|
|
16.6 % |
20.4 % |
16.2 % |
19.2 % |
17.4 % |
20.6 %# |
+24.1 % |
|
Cefoxitin-R |
|
|
5.2 % |
5.8 % |
5.4 % |
4.7 % |
8.0 % |
6.0 %# |
+15.4 % |
|
3GC-R |
11.9 % |
21.2 % |
11.5 % |
14.5 % |
13.5 % |
14.6 % |
14.5 % |
17.6 % |
+61.7 %* |
|
Cefotaxime/ceftriaxone-R |
|
|
10.5 % |
13.3 % |
13.0 % |
12.8 % |
14.2 % |
17.4 %# |
+65.7 %* |
|
Ceftazidime-R |
|
|
9.9 % |
10.4 % |
13.3 % |
12.7 % |
12.6 % |
13.8 %# |
+39.4 %* |
|
ESBL-producers |
8.8 % |
18.4 % |
10.8 % |
12.8 % |
11.8 % |
12.6 % |
14.5 % |
15.3 %# |
+41.7 %* |
|
Ciprofloxacin-R |
11.9 % |
20.9 % |
13.5 % |
16.8 % |
11.5 % |
15.9 % |
18.6 % |
17.3 % |
+48.9 %* |
|
Gentamicin-R |
9.6 % |
16.9 % |
11.8 % |
15.5 % |
11.0 % |
11.1 % |
11.8 % |
11.4 %# |
-3.4 % |
|
Gentamicin/Amikacin/Tobramycin-R |
9.9 % |
17.8 % |
12.1 % |
16.5 % |
11.5 % |
11.9 % |
13.0 % |
11.0 % |
+3.3 % |
|
Carbapenem-R |
0.3 % |
1.2 % |
0.6 % |
1.8 % |
0.9 % |
0.6 % |
0.6 % |
0.9 % |
+83.3 %* |
|
% Multi-Drug Resistance |
10.2 % |
19.7 % |
7.3 % |
7.5 % |
5.8 % |
6.1 % |
8.3 % |
5.3 % |
+13.7 % |
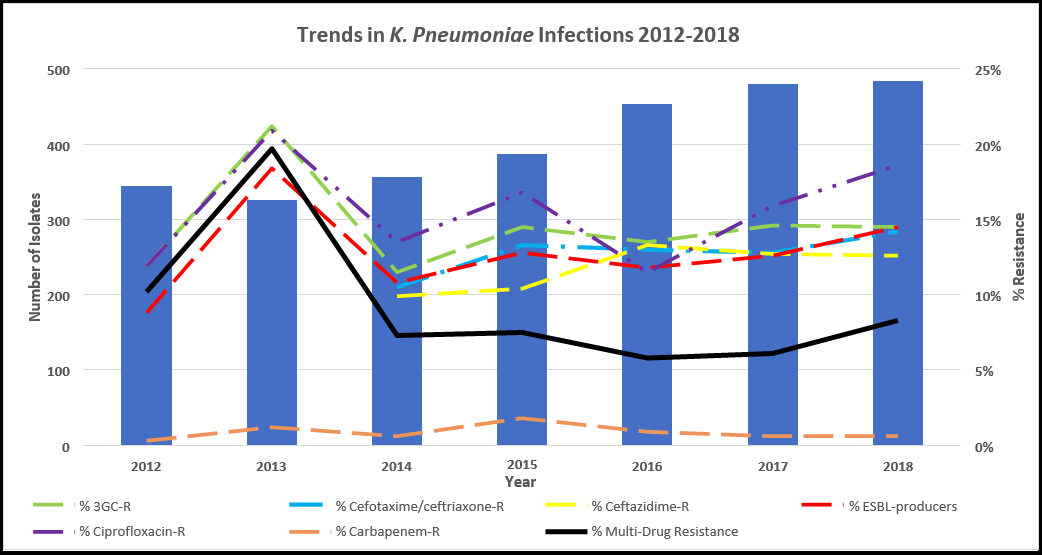
Figure 5: Trends in K. pneumoniae infections and the rate of resistance for each antibiotic, which showed significant changes in the seven years from 2012-2018 in the Republic of Ireland, and the overall multidrug resistance rate of K. pneumoniae isolates for each year.
3.7 Multi-Drug Resistance Trends
It can be seen from Table 9 for the years 2014-2018 that the incidence rate of E. coli, which exhibited resistance to two or more families of drugs, rose statistically significantly over the period, increasing from 5.0 % to 6.2 % or a rise of 24.0 % on the 2014 value (Pearson’s Correlation, P < 0.05). The incidence rate of multi-drug resistant K. pneumoniae increased by 13.7 % over the 2014 figure in the 4 years to an incidence rate of 8.3 %, a five-year high. Multi-drug resistant E. faecium showed the most significant increase in incidence, rising to 30.1% of isolates exhibiting resistance to two or more drug types, an increase of 35.6 % on the 2014 figure. The only pathogen that showed a decrease in the proportion of isolates exhibiting multi-drug resistance was P. aeruginosa which dropped by 45.6 % on the 2014 figure to a five-year low of 3.1 %. However, aside from E. coli, there are no other statistical trends.
See Figure 6 for a depiction of trends over time. While the half-year data for 2019 does not adequately represent the full-year data due to the end-of-year increase in infections and illness during the winter season, the incidence rates appear to be consistent with previous years, with the most notable change being that of the rise of P. aeruginosa back to the levels seen in 2018.
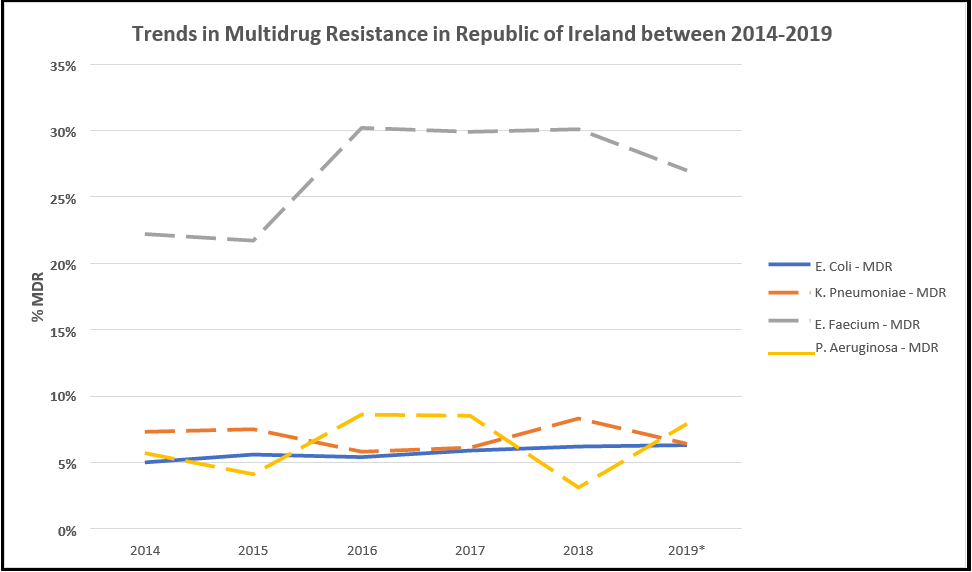
Figure 6: Summary of the rates of multidrug resistance with available data on E. coli, K. pneumoniae, E. faecium, and P. aeruginosa.
Table 9: Multi-drug resistance trends of various microbes from 2014 to 2019. %Δ denotes the percentage change between 2014 and 2018 as a proportion of the 2014 figure. # Indicates figures for which only half-year data for Q1 and Q2 was available. *Represents a statistically significant trend between 2014-2018 by Pearson’ Correlation (P < 0.05) (Source data [35])
|
|
2014 |
2015 |
2016 |
2017 |
2018 |
2019 |
%Δ |
|
E. Coli |
5.0 % |
5.6 % |
5.4 % |
5.9 % |
6.2 % |
6.3 %# |
+24.0 %* |
|
K. Pneumoniae |
7.3 % |
7.5 % |
5.8 % |
6.1 % |
8.3 % |
6.4 %# |
+13.7 % |
|
E. Faecium |
22.2 % |
21.7 % |
30.2 % |
29.9 % |
30.1 % |
27.0 %# |
+35.6 % |
|
P. Aeruginosa |
5.7 % |
4.1 % |
8.6 % |
8.5 % |
3.1 % |
7.9 %# |
-45.6 % |
4. Discussion
This work aimed to determine the current trends related to HCAIs in the Irish healthcare setting, both in hospitals and community healthcare centers, and to analyze trends in antimicrobial and multidrug resistance in Ireland. Data were analyzed from several publications of the Health Protection Surveillance Centre (HPSC), the Health Service Executive (HSE), the World Health Organisation (WHO), and the European Centre for Disease Control (ECDC). We analyzed the data to assess statistical trends or differences in incidence proportion for different infection types and will summarise our findings below.
Based on HPSC data, it was found that there was a statistically significant increase in the proportion of patients experiencing an HCAI from 2012 to 2017. However, the incidence rate of 6.13 % in 2017 is still lower than the European average of 6.7 % [36]. Suetens et al. comprehensively analyzed HCAI rates across all European countries in 2016/2017. Lithuania was reported to have the lowest prevalence of 2.9 %, with the highest reported being Greece at 10 % [37]. The prevalence rate in Ireland fits very much in the median range of reported figures. There are few studies comparing trends in prevalence across different time points. However, a study comparing HAI prevalence rates from 2010 to 2017 in Dutch nursing homes reported a statistically significant decrease in HAIs across those time points [38]. The prevalence of HCAIs in acute care hospitals in Lithuania decreased slightly from 4.3 % to 3.4 % from 2003 to 2007, although this is not statistically significant [39].
Beyond these published findings, it is difficult to conclude the trends in prevalence rates amongst other European countries and whether the statistically significant increase we have noted here is reflected elsewhere or an anomaly amongst our European counterparts. Ireland’s HCAI prevalence rate was reported to be 4.9 % in 2006 [40], so this lower rate, coupled with a rising prevalence between 2012 to 2017, points to a definite increase rather than a decrease in overall HCAIs.
The most frequent HCAIs reported were Surgical Site Infections, Pneumonia, Urinary Tract infections, Bloodstream infections, Gastrointestinal system infections, and systemic infections, representing over 80% of all infection types. This is reflective of the frequency of HCAIs reported in the US and UK [41,42].
There are statistically significant decreases in Gastrointestinal system infections, Bone & joint infections, and Neonatal specific infections between 2012 and 2017.
This is most likely due to increased infection control awareness and education [43,44]. Of these infection types, there was a statistically significant increase in pneumonia infections between 2012 and 2017 of 68 %. Pneumonia is the most common HCAI in the ICU, accounting for 54.5 % of infections [28]. Of these ICU pneumonia infections, 57 % of patients were intubated, and the most common pathogen identified was Enterobacteriaceae, followed by S. aureus, which was methicillin susceptible (MSSA).
A US study on Ventilator-associated pneumonia (VAP) showed an incidence rate of 35 %. Of these patients, Staphylococcus aureus, Klebsiella pneumoniae, Pseudomonas aeruginosa, Acinetobacter baumannii, and Escherichia coli were the most common pathogens associated with VAP [45]. Risk factors for VAP have long been noted as the duration of mechanical ventilation ≥7 days, prior antibiotic use, and prior use of broad-spectrum drugs. However, recent investigations reported no difference in aetiologies in patients as a result of length of ventilator use or comorbidity. The most significant risk factor in VAP outcome was the presence of multidrug-resistant organisms [46,47]. Papazian et al. 2020 relate this to the worldwide rise in MDR pathogens and highlight that the most critical risk factor for acquiring MDR pathogens associated with VAP is the local ICU ecology, regardless of the length of intubation [46,47]. In the context of the Irish data showing a significant increase in pneumonia HCAIs, there is a need to examine MDR rates here.
Appropriate use of antibiotics is a critical method in reducing the rate of HCAI each year. By identifying the exact pathogen in patients and determining their specific antibiotic susceptibility, hospital staff can prevent subscription of broad-spectrum antibiotics and use a pathogen-specific antibiotic. Using a pathogen-specific antibiotic makes that patient much less likely to demonstrate resistance in the future to other antibiotics that may treat several pathogens. Hellyer et al. 2020 performed a randomized controlled trial to examine antibiotic stewardship in suspected VAP cases in hospitals across England, Scotland, and Northern Ireland. Biomarker tests to assess levels of IL- 1B and IL-8 were performed to exclude the possibility of VAP in intubated patients for 48 hours. If the results showed low levels of these biomarkers, clinicians were advised to discontinue antibiotic treatment. Results showed no significant difference in the distribution of antibiotics between treatment and control groups. They concluded that there was a reluctance to change antibiotic prescribing practices and adapt biomarker testing methods which could serve as a valuable predictor for the progression of VAP [48].
Our analysis of Irish data shows a significant increase in antibiotic prescription in the hospital setting between 2012 and 2017 (see Table 3), highlighting an invisible crisis brewing for future antimicrobial resistance rates in Ireland growing in the coming years. Antibiotic prescription in the community remains consistent from 2012 through 2020. Although there was a statistically significant decrease in the consumption of antibacterials across Europe between 2011-2020, there was no substantial reduction in Ireland [49].
Rates of antimicrobial resistance remain consistent over time from 2015 to 2019 (see Table 5) for antimicrobials, Fluoroquinolone, Methicillin, Vancomycin, and Penicillin against specific isolates. However, there have been significant increases in Escherichia coli isolate resistance over time from 2014-2018 for drugs Amoxicillin- clavulanic acid-R, 3GC-R, Cefotaxime/ceftriaxone-R, Ceftazidime- R, and ESBL-producers (see Table 7). Overall, there is a statistically significant increasing trend in percentage multidrug resistance over the 5 years, and this trend continues for the first half of 2019. There are substantial increases in Klebsiella pneumoniae resistance to drugs Cefotaxime/ceftriaxone-R and Ceftazidime-R (see Table 8). Overall, there is a statistical trend toward increasing rates of MDR for E. coli over time (see Table 9). As stated in the introduction, Ireland has one of the highest proportions of vancomycin-resistant E. faecium in Europe; however, this does show some signs of decreasing, according to the data presented. The cause of the higher prevalence of E. coli- based infections in Ireland may be partly due to our water supplies and coastline use. A recent study completed by [50] demonstrated that surfers were 3x more likely to ingest and become colonized by CTX- M-producing E. coli. Ireland currently discharges most of its sewage into the ocean, but it is untreated before removal. In 2020, there were 35 sites across Ireland where raw sewage flowed directly into rivers and the sea [51].
There were significant differences in the rates of MDR reported for E. Coli and K. Pneumoniae in the 2014 data available. For example, the MDR rate reported for E. Coli in 2014 in the 2017 point prevalence report was 5.0 % [2], while in an older epidemiology report from 2016 [34], the MDR for E. Coli was reported as 15.0 %. This was because several antibiotics were removed from use due to high rates of resistance. For example, in 2015, there were 23 antibiotics on the AMR reporting protocol for E. Coli, while in 2020, there were only 22 with Nalidixic Acid, Doripenem, and Polymixin B removed from the reporting protocol after 2015 with Piperacillin- Tazobactam and Norfloxacin added to the reporting protocol by 2020 [52,53]. Older MDR data was subsequently re-calculated in the 2017 report to only include the antimicrobials on the reporting form at that time so that direct comparisons could be made to prior years.
Hand hygiene is often the first place to start when attempting to reduce the incidences of HCAIs anywhere in the world. Overall, ensuring good hygiene practices are implemented and maintained by all hospital staff, including doctors, nurses, technicians, and porters, will reduce HCAI levels. Visitors to a healthcare setting need to also be reminded of the importance of hand hygiene. Another relatively simple method of preventing HCAI is to minimize the time the patient remains in the hospital, but this is only sometimes achievable for several reasons. Preventing cross-contamination between hospital patients and staff is a crucial parameter in controlling HCAIs. Ensuring adequate staff at any time in the hospital can also be a key determinant in reducing the incidences of HCAI. Studies have shown that understaffed hospital teams wash their hands before contacting devices only 25% of the time, but this increases to 70% once understaffing, and overcrowding cease [54].
Currently, there are initiatives outside of the healthcare setting to prevent the spread of antibiotic resistance. For example, intensive usage of zinc in animal diets favors the development of bacterial resistance. Bacteria regulate intracellular zinc concentration with a system of efflux pumps. These pumps can be specific to zinc or evacuate other molecules like antibiotics. High levels of zinc tend to increase their synthesis; thus, using zinc oxide at pharmacological dosages reduces the sensitivity of bacteria to antibiotics. In Europe, a new directive as of May 2022 will reduce the maximum permissible amount of zinc oxide in animal feed diets from 2,000 ppm to 100pm [56].
Recently published ‘Ireland’s Second One Health National Action Plan on Antimicrobial Resistance’ aims to provide a ‘cross-sectorial response to AMR, while ensuring availability of effective antimicrobial treatment .’There is an emphasis in the plan on infection prevention and control [43]. Measures introduced to date have included such focused programs as the surveillance, monitoring, and management of Carbapenemase Producing Enterobacterales (CPE). Learnings from this program have informed the response to the management of COVID-19 outbreaks, and in turn, learnings from COVID-19 are informing this policy. Monitoring and adherence to key performance indicators identified will tackle the problem of AMR. Prevention is a much better approach than cure. Relying heavily on antibiotics to treat these HCAIs is ultimately a short-term solution, as the ever-increasing rates of AMR will soon mean simple infections will be untreatable, with the current rate of AMR across all indications steadily rising.
Interestingly, drug resistance to S. aureus has steadily decreased over the last 10 years, as in Figure 3. In the UK, a similar trend was observed about the rates of MRSA. In the early 2000s, MRSA was widespread in the UK and Ireland until new infection control programs were introduced. It was discovered that the doctors and hospital staff primarily transferred MRSA between patients. This led to initiatives aimed at ensuring any person who enters a hospital setting would wash their hands before joining and to encourage doctors and nurses to wash their hands as much as possible between patient visits. In the UK, between 2007-2016, there was a staggering 97 % reduction in MRSA bloodstream infections in ICU patients and a 78 % decrease in bloodstream infections overall [55]. Other preventative measures to reduce the incidences of MRSA include nasal decolonization upon entry to a hospital setting, as many patients harbor the pathogenic microbe within their nasal cavity, although further research is needed to verify this technique [56]. Ireland had drastically reduced its rates of MRSA, with the decline beginning in 2006 when MRSA rates were over 40 % [32].
5. Conclusions
This chapter examined available literature on the occurrence of Health care-associated infections (HCAIs) and trends in Antimicrobial Resistance (AMR) in the Republic of Ireland. We note a statistically significant increase in the proportion of patients experiencing an HCAI from 2012-2017, with the most frequently reported HCAIs being Surgical Site Infections, Pneumonia, and Urinary Tract infections. Although there are some statistically significant decreases in HCAIs, such as Gastrointestinal system infections, Bone & joint infections, and Neonatal specific infections, there has been a substantial increase in the incidence of HCAI pneumonia infection over time between 2012-2017. The most common risk factor for HCAI pneumonia is due to intubation or ventilator-associated pneumonia (VAP). Recent research has shown that the local ecology of the intensive care unit is most critical when determining an intubated patient’s risk of acquiring VAP, which is linked to a worldwide increase in multidrug-resistant (MDR) pathogens. Indeed, in this chapter, we note an overall increased rate of MDR against E. coli and an increasing rate of Klebsiella pneumoniae resistance to certain drugs. Appropriate antibiotic stewardship is critical to combat MDR and Antimicrobial Resistance (AMR), yet evidence here suggests a significant increase in antibiotic prescription in the Irish hospital setting between 2012 and 2017.
Efforts to reduce the occurrence of HCAIs focus on practical hygiene measures, particularly hand hygiene. In particular, initiatives aimed at reducing the spread of MRSA have been very successful and resulted in a massive decrease in MRSA incidence over time in Ireland, which continues to decrease.
From a healthcare perspective, there is a critical need to take a holistic approach to tackling AMR, and this has been recognized with the publication of ‘Ireland’s Second One Health National Action Plan on Antimicrobial Resistance.’ The plan looks to tackle AMR at several levels, not only through surveillance and monitoring of disease outbreaks and responsible stewardship of antibiotics but also by looking at animal health and the food chain and the impact of the environmental dimension of AMR. Paramount to these interventions having an effect is the education and change of mindset needed amongst stakeholders to recognize the dire global threat AMR presents so that we take action now.
Abbreviations
AMR: Antimicrobial resistance
BDU: Bed days used
BSI: Blood Stream Infection
CAUTI: Catheter-associated urinary tract infection
ECDC: European Centre for Disease Control
HCAI: Healthcare-associated infection
ICU: Intensive Care Unit
MDR: Multidrug resistance
MRSA: Methicillin-resistant Staphylococcus aureus
PNSP: Penicillin non-susceptible S. pneumoniae
SSI: Surgical site infection
UTI: Urinary tract infection
VREfa: Vancomycin-resistant E. faecalis
VREfm: Vancomycin-resistant E. faecium
VTEC: Verotoxigenic Escherichia coli
Declarations: Ethics approval and consent to participate
Not Applicable: Consent for publication
Not Applicable: Availability of data and materials
The datasets used and analyzed during the current study are available from the corresponding author upon reasonable request.
Competing interests: Not Applicable
Funding: Not Applicable
Authors' contributions: CB analyzed and prepared all figures and tables within the manuscript, RB prepared much of the information in the background and methods section, TP and JB reviewed initial drafts of the manuscript, verified data sets included and contributed to the writing of the manuscript, AB carried out all statistical analysis of the data sets, prepared figures and tables and was a major contributor in writing the manuscript.
Acknowledgments: Not Applicable
Authors' information (optional): Not Applicable
References
- Haque M, Sartelli M, McKimm J, Abu Bakar M (2018) Health care-associated infections - an overview Infection and Drug Resistance. 11: 2321-2333.
- HSC. Health Protection Surveillance Centre, Point Prevalence Survey of Hospital Acquired Infections and Antimicorbial Use inEuropean Acute Care Hospitals. 2017.
- Schreiber PW, Sax H, Wolfensberger A, Clack L, Kuster SP, et al. (2018) The preventable proportion of healthcare-associated infections 2005–2016: Systematic review and meta-analysis. Infection Control & Hospital Epidemiology.39(11): 1277-1295.
- VanEpps JS, Younger JG (2016) Implantable Device Related Infection. Shock.46(6): 597-608.
- Antimicrobial Resistance Collaborators (2022) Global burden of bacterial antimicrobial resistance in 2019: a systematic analysis. The Lancet. 399(10325): 629-55.
- Control ECfDPa. Antimicrobial resistance in the EU/EEA (EARS-Net) -Annual Epidemiological Report 2019. Stockholm: ECDPC; 2019.
- Edwards M, Hamilton R, Oliver N, Fitzgibbon S, Samarasekera R (2019) Antibiotic Resistance: Modelling the Impact on Mortality and Morbidity A report by the Antibiotic Resistance Working Party. Edinburgh: Institute and Faculty of Actuaries; 2019.
- CPE. Discussing healthcare associated infection (HCAI) and specific antimicrobial resistant organisms (AMROs) with patients who may have acquried a HCAI, become colonised with an AMRO or been exposed to a specific HCAI/AMR risk. Dublin: HSE; 2018.
- HSC. Point prevalence Survey of Hospital Acquired Infections &Antimicrobial Use in Euopean Acute Care Hospitals. 2012.
- Edgeworth JD, Batra R, Wulff J, Harrison D (2020) Reductions in Methicillin-resistant Staphylococcus aureus, Clostridium difficile Infection and Intensive Care Unit–Acquired Bloodstream Infection Across the United Kingdom Following Implementation of a National Infection Control Campaign. Clinical Infectious Diseases. 70(12): 2530-2540.
- Llor C, Bjerrum L (2014) Antimicrobial resistance: risk associated with antibiotic overuse and initiatives to reduce the problem. Therapeutic Advances in Drug Safety. 5(6): 229-41.
- ECDC. Healthcare-associated infections acquired in intensive care units. Stockholm European Centre for Disease Prevention and Control - Annual Epidemiological Report 2016; 2017.
- Badia JM, Casey AL, Petrosillo N, Hudson PM, Mitchell SA, et al. (2017) Impact of surgical site infection on healthcare costs and patient outcomes: a systematic review in siz European countries. Journal of Hospital Infection.96(1): 1-15.
- Medicine JH. Evidence-based Best Practices for SSI Prevention. John Hopkins University; 2010.
- Weigelt JA, Lipsky BA, Tabak YP, Derby KG, Kim M, et al. (2010) Surgical site infections: Causative pathogens and associated outcomes. American Journal of Infection Control. 38(2): 112-20.
- Kolasinki W (2019) Surgical infections-review of current knowledge and methods of prevention. Polish Journal of Surgery.91(4): 41-47.
- Anderson MJ, Flores-Mireles AL (2019) Urinary Catheter Coating Modifications: The Race Against Catheter Associated Infections. Coatings.10(1): 23.
- Peng D, Li X, Liu P, Luo M, Chen S, et al. (2018) Epidemiology of pathogens and antimicrobial resistance of catheter associated urinary tract infections in intensive care units: A systematic review and meta-analysis. American J of Infection Control. 46(12): e81-e90.
- Zimlichman E, Henderson D, Tamir O, Franz C, Song P, et al. (2013) Healthcare associated infections: a meta-analysis of costs and financial impact on the US health care system. JAMA InternalMedicine. 173(22): 2039-46.
- Viscoli C (2016) Bloodstream Infections: The peak of the iceberg.Virulence. 7(3): 248–251.
- Control ECfDPa. Healthcare-associated infections acquired in intensive care units Stockholm: ECDC; 2021.
- Control ECfDPa. Healthcare associated infections acquired in intensive care uits. Stockholm: ECDC; 2017.
- HPSC. Health Protection Surveillance Centre. HPSCIE2022.
- HPSC. Enhanced EAR-Net Surveillance. 2017.
- HPSC DH. Antimicrobial Resistance in Ireland 2018. Dublin HSE; 2018.
- HSE. VTEC Infection in Ireland 2017. HSE; 2017.
- HSE. Infectious Disease Notifications in Ireland 2015-2020. Dublin: HSE; 2020.
- HSE. EARS-Net data on antimicrobial resistance in Ireland-Quarter 1-2 2019. Dublin RESIST 2019.
- Organisation WH. Global Action Plan on AntimicrobialResistance Geneva: WHO; 2015.
- Organisation WH. Defined Daily Dose (DDD). WHO 2022.
- ECDC. Country Summaries - AER-EARS-Net 202019. Stockholm ECDC; 2019.
- HPSC. HPSC Annual Report 2012. Dublin: HPSC; 2012.
- ECDPAC (2013) Antimicrobial resistance surveillance in Europe.Stockholm ECDC.
- HPSC (2016) HPSC Annual Epidemiological Report.
- HPSC DH. Antimicrobial Resistance in key pathogens causing invasive infections in Ireland 2018. Dublin: HSE; 2018.
- ECDC (2018) Infographic: Healthcare-associated infections – a threat to patient safety in Europe.
- Suetens C, Latour K, Kärki T, Ricchizzi E, Kinross P, et al. (2018) Prevalence of healthcare-associated infections, estimated incidence and composite antimicrobial resistance index in acute care hospitals and long-term care facilities: results from two European point prevalence surveys, 2016 to 2017.Eurosurveillance. 23(46): 1800516.
- Eikelenboom-Boskamp A, Saris K, van Loosbroek M, Drabbe MIJ, de Jongh F, et al. (2019) Prevalence of healthcare- associated infections in Dutch nursing homes: follow-up 2010– 2017. Journalof Hospital Infection. 101(1): 49-52.
- Valinteliene R, Gailiene G, Berzanskyte A (2012) Prevalence of healthcare-associated infections in Lithuania. Journal of HospitalInfection. 80(1): 25-30.
- HPSC. The Third Prevalence Survey of Healthcare Associated Infections in Acute Hospitals: Republic of Ireland Preliminary results 2006.
- Magill SS, Edwards JR, Bamberg W, Beldavs ZG, Dumyati G, et al. (2014) Multistate Point- Prevalence Survey of Health Care- Associated Infections. New England Journal of Medicine. 370(13): 1198-208.
- Guest JF, Keating T, Gould D, Wigglesworth N (2020) Modelling the annual NHS costs and outcomes attributable to healthcare- associated infections in England. BMJ Open. 10(1): e033367.
- Ireland Go. Ireland’s One Health National Action Plan on Antimicrobial Resistance 2021 – 2025 (known as iNAP2). HSE Quality Improvement Division and the HCAI/AMR Committees;2021.
- HSE. (2015) Core Infection Prevention and Control Knowledge and Skills: A Framework Document. In: HSE, Committees QIDatHA, editors.
- Kabak E, Hudcova J, Magyarics Z, Stulik L, Goggin M, et al. (2019) The utility of endotracheal aspirate bacteriology in identifying mechanically ventilated patients at risk for ventilator associated pneumonia: a single-center prospective observational study. BMC infectious diseases. 19(1): 756.
- Papazian L, Klompas M, Luyt CE (2020) Ventilator-associated pneumonia in adults: a narrative review. Intensive care medicine.46(5): 888-906.
- Martin-Loeches I, Torres A, Rinaudo M, Terraneo S, de Rosa F, et al. (2015) Resistance patterns and outcomes in intensive care unit (ICU)-acquired pneumonia. Validation of European Centre for Disease Prevention and Control (ECDC) and the Centers for Disease Control and Prevention (CDC) classification of multidrug resistant organisms. Journal of Infection. 70(3): 213- 22.
- Hellyer TP, McAuley DF, Walsh TS, Anderson N, Conway Morris A, et al. (2020) Biomarker-guided antibiotic stewardship in suspected ventilator-associated pneumonia (VAPrapid2): a randomised controlled trial and process evaluation. The Lancet Respiratory Medicine. 8(2): 182-91.
- Control ECfDPa. Antimicrobial consumption in the EU/EEA (ESAC-Net). Stockholm: ECDC; 2021.
- Leonard AFC, Zhang L, Balfour AJ, Garside R, Hawkey PM, et al. (2018) Exposure to and colonisation by antibiotic resistant E. Coli in UK coastal water users: Envirnmental surveillance, exposure assessment, and epidemiology study (Beach Bum Survey). Envirnomental International. 114: 326-33.
- O'Sullivan K (2020) RAw sewage flowing into rivers and sea in 35 places across Ireland. The Irish Times.
- System T-TES. Antimicrobial resistance (AMR) reporting protocol 2020. Stockholm ECDC; 2020.
- System T-TES. Antimicrobial resistance (AMR) reporting protocol 2015. Stockholm ECDC; 2015.
- Harbarth S, Sudre P, Dharan S, Cadenas M, Pittet D (1999) Outbreak of cloacae related to understaffing, overcrowding, and poor hygiene practices. Infection Control Hospital Epidemiology. 20(9): 598-603.
- Edgeworth JD, Batra R, Wulff J, Harrison D (2020) Reductions in Methicillin-resistant Staphylococcus aureus, clostridium difficile infection and intensive care unit - acquired bloodstream infection across the United Kingdom following implementation of a National Infection Control Campaign. Clinical Infectious Diseases. 70(12): 2530-40.
- Bode LG, Kluytmans JA, Wertheim HF, Bogaers D, Vandenbroucke-Grauls CM, et al. (2010) Preventing surgical site infections in nasal carriers of staphylococcus aureus. The New England Journal of Medicine. 362(1): 9-17.