


Gustavo Bergonzoli MD1, *, David Santiago Delgado Grijalba2, Felipe José Tinoco Zapata3
1Epidemiologist, Coordinador grupo de Gestión del Conocimiento e Innovación (GECOI). Hospital Tomas Uribe Uribe. Tuluá, Colombia Production and Management Knowledge Foundation Director (PROGRESCO). Cali, Colombia. ORCID 0000-0001-9728-5329.
2Statistician-Epidemiologist, Líder del proceso de Investigación. Hospital Tomas Uribe Uribe. Tuluá, Colombia. ORCID 0000-0002-0803-9060.
3Médico-Salubrista. Gerente del Hospital Tomas Uribe Uribe. Tuluá, Colombia. ORCID 0000-0002-9386-0573 The author’s contribution was equal.
*Correspondence: Gustavo Bergonzoli MD, Epidemiologist, Coordinador grupo de Gestión del Conocimiento e Innovación (GECOI). Hospital Tomas Uribe Uribe. Tuluá, Colombia, Production and Management Knowledge Foundation Director (PROGRESCO). Cali, Colombia. ORCID-0000-0001-9728-5329.
Abstract
Objective
To identify factors associated with Diabetes mellitus.
Methodology
From an observational study carried out in 9,000 families, the MIXED procedure was applied to identify the factors associated with glycated Hemoglobin, taken as a proxy for diabetes mellitus. Results. The factors that increase the probability of diabetes, the occurrence is systolic blood pressure (β = 0.0126, 90 % CI 0.0015, 0.0237), LDL (β = 0.00726, 90 % CI 0.004, 0.0106) and fruit consumption (β = 1.0679, 90 % CI 0.4955, 1.6405). Those that decreased it are diastolic blood pressure (β = -0.0134, 90 % CI -0.0550, -0.0096), HDL (β = -0.0107, 90 % CI - 0.0160, -0.0106), arterial index (β = -0.0199, 90 % CI -0.0399, -0.001) and alcohol consumption (-0.4357, 90 % CI -0.8500, -0.0214).
Discussion
As is often the case with reports from other investigations, some factors tend to match, and others do not, despite those differences to intervene modifiable factors, such as blood pressure, fruit intake, HDL, and LDL; represents opportunities for improving diabetes control.
Conclusion
The factors found could be used by health service providers as tracer elements for the early detection of people at risk of developing diabetes.
Introduction
Type 2 Diabetes is a disease with a long clinical evolution and of great economic and public health impact. Globally, the prevalence of diabetes in adults over 18 years of age increased from 4.7 % in 1980 to 8.5 % in 2014. The number of people with diabetes rose from 108 million in 1980 to 422 million in 2014. The disease has increased faster in low- and middle-income countries than in high-income countries. The prevalence of the disease tends to increase with age and is associated with a sedentary lifestyle, being overweight or obese, an unhealthy diet, consumption of tobacco, alcohol, sugary drinks, abdominal circumference, waist circumference, and other recently reported factors such as lack of good quality sleep, air pollution, and stress. Diabetes is a major cause of blindness, kidney failure, heart attack, stroke, and lower limb amputation. It is estimated that, in 2016, it was the direct cause of 1.6 million deaths, ranking seventh as the cause of death, in the world. Hyperglycaemia, on the other hand, contributed to 2.2 million deaths; half of the deaths attributable to this biomarker occur before the age of 70, which are considered premature deaths [1].
In Colombia, according to data from the High-Cost Account, between July 2017 and June 2018, a prevalence of 2.61 was reported in people aged 18 to 69 years of age, with a recruitment percentage of 74.24 %. Meanwhile, between July 2016 and November 2017, there were 1,099,471 people affiliated with the General System of Social Security in Health. Reaching a prevalence in health services of 2.2, which represents an increase of 87,469 people more than in the previous period, being always higher in women (58.9 %) than in men (41.7 %), although the gender gap is particularly significant between 2015 and 2017 [2].
In 2019, high fasting plasma glucose ranked sixth in DALYs, among level 2 factors, representing 2,223.8 DALYs at all ages, with a 95 % CI (1.842,1 – 2.648,2) per 100,000 inhabitants and 84.0 deaths, in all ages, with a 95 % CI (66.1 - 108.1) per 100,000 inhabitants, worldwide [3]. Type 2 Diabetes is expected to continue to increase in the next twenty years and more than 70 % of patients will appear in developing countries, most of whom will be people between the ages of 45 and 64 [4].
The health costs derived exclusively from diabetes care, worldwide, have been estimated at the US $548 billion dollars in 2013, 11 % of the total health expenditure in adults [5]. In 2012, in the US, the total cost of care for diagnosed diabetes was approximately US $ 245 million dollars, 21 % more than in 2007 [6].
The objective of this the project was to identify the main risk factors associated with the occurrence of type 2 diabetes in the population residing in the municipality of Santiago de Cali, Colombia.
Methodology
Design and subject of the study. Multiple linear regression was applied to a database from an observational study of prevalence, with glycosylated glucose as the response variable.
The study was carried out in the municipality of Santiago de Cali, from a multi-stage and representative random sample survey applied to the residents of the 22 communes in the city. The sample consisted of 4,000 randomly selected homes where 9,000 families were interviewed.
The survey was conducted by the Center for the Development and Evaluation of Policies and Technologies in Public Health (CEDETES) at Universidad Del Valle, in Cali, Colombia.
Variables under study.
Inclusion criteria. Data were taken from a subsample from the original database. The biomarkers studied were glucose, total cholesterol, HDL, LDL, triglycerides, systolic and diastolic pressure, weight, height, abdominal circumference, hip circumference, and some sociodemographic variables, such as age, sex, marital status, race/ethnicity, educational level, socioeconomic status, and income.
Exclusion criteria. Those registries that had a previous diagnosis of diabetes, those that were shorter than 1.35 centimetres; weighing 35 kg or less; diastolic pressure less than or equal to 40 mm and greater than 200 mm / Hg; systolic pressure less than or equal to 40 mm or greater than 200 mm / Hg; triglycerides less than 80mg or greater than 1,300 mg/dl. Furthermore, incomplete records that were of interest to the model were eliminated. In the end, 26 variables and 423 complete records became available. The glycosylated Hemoglobin values used to classify the study subjects were normal less than 5.7, pre-diabetic between 5.7 and 6.4, and diabetes values equal to or greater than 6.5 mg/dl [7].
The response variable, type 2 diabetes, was measured based on the levels of glycosylated glucose in the blood, using the glycosylated haemoglobin test. The quantitative independent variables were measured in the usual way and “dummy” variables were created for categorical variables, taking into account avoiding introducing collinearity in the analysis. Measurement errors were considered independent of each other, that is, they covaried freely.
Analysis plan
The methodological approach used to analyse the data by hand consisted of two phases: during the first phase, an exploratory analysis was carried out, the numerical variables were examined to evaluate the assumptions of the linear regression and identify extreme values that could affect the stability and the magnitude of the estimated coefficients [8]. The presence of numerical errors, such as collinearity established using the Variance Inflation Factor (VIF) [9] the statistic was evaluated. It was also verified that the residuals presented a normal or approximate distribution. For the multivariate linear regression analysis in the second phase, the Proc MIXED procedure was applied, and the independent variables were selected using the Stepwise procedure to generate a parsimonious model that contained the least possible number of variables that could explain most of the variation of the response or dependent variable, using the alpha level < 0.10 as a reference.
The < 0.10 alpha level was used in order to increase the detection power, beyond 80 %, since the sample size was fixed. The statistical Proc Mixed procedure was applied since its results suggest, that the Improved General Approach procedure, through the Kenward-Roger, as well as the Brown-Forsythe and Welch-James solutions, control Type I error rates, quite well, for both the main effect and for the effect of the interaction term, under all the conditions, evaluated [10,11,12].
PROC MIXED does not produce a variance table analysis, because it uses estimation methods based on different principles. Its calculation formula is based on ML (Maximum Likelihood), REML (Restricted or Residual Maximum Likelihood, which is the default method), and MIVQUE0 (Minimum Variance Square Unbiased Estimate).
The ML and REML procedures are based on a maximum likelihood estimation approach and require the assumption that the dependent variable distribution (error term and random effects) is normal [13]. Statistical analysis was performed using SAS® software, version 9.4 [14].
Results
In the sample studied, women were 65.2 %. Regarding the specific age groups, among men the 30-40 years old stood out with 21.9 % of type 2 Diabetes. Amongst women, the group between 50-54 years of age stood out, with 23.1 %.
Table 1. Percentage distribution of the study population, according to age and sex.
|
Gender Male Female (n = 146) (n =273) |
||||
|
AGE |
n |
% |
n |
% |
|
18-19 |
5 |
3.4 |
3 |
1.1 |
|
20-24 |
11 |
7.5 |
19 |
6.7 |
|
25-29 |
10 |
6.9 |
25 |
9.2 |
|
30-34 |
11 |
7.5 |
15 |
5.5 |
|
35-39 |
7 |
4.8 |
16 |
5.9 |
|
40-44 |
9 |
6.2 |
24 |
8.8 |
|
45-49 |
23 |
15.8 |
35 |
12.8 |
|
50-54 |
15 |
10.3 |
39 |
14.3 |
|
55-59 |
13 |
8.3 |
24 |
8.8 |
|
60-64 |
12 |
8.2 |
32 |
11.7 |
|
65-69 |
10 |
6.9 |
13 |
4.8 |
|
70-74 |
5 |
3.4 |
11 |
4.0 |
|
75-79 |
6 |
4.1 |
9 |
3.3 |
|
80 and over |
9 |
6.2 |
8 |
2.9 |
|
Total |
146 |
|
273 |
|
*Source: own estimation.
Table 2. Percentage distribution of the study population, according to sex and glycosylated hemoglobin.
|
Glycosylated glucose |
Gender Male Female n % n % |
|||
|
Diabetes |
67 |
34.2 |
129 |
65.8 |
|
Pre-diabetes |
52 |
36.9 |
89 |
63.1 |
|
Normal |
29 |
33.7 |
57 |
66.3 |
*Source: own estimation.
Table 3. Percentage distribution of the study population, according to age and glycosylated hemoglobin.
|
Glycosylated glucose |
Diabetes (>= 6.50) |
Normal (< 5.7) |
Prediabetes (5.7 – 6.4) |
||||
|
AGE |
(n %) |
(n %) |
(n %) |
N |
|||
|
18-19 |
1 |
12,5 |
1 |
12,5 |
6 |
75,0 |
8 |
|
20-24 |
8 |
26,7 |
7 |
23,3 |
15 |
50,0 |
30 |
|
25-29 |
13 |
37,1 |
8 |
22,9 |
14 |
40,0 |
35 |
|
30-34 |
11 |
42,3 |
6 |
23,1 |
9 |
34,6 |
26 |
|
35-39 |
9 |
39,1 |
6 |
26,1 |
8 |
34,9 |
23 |
|
40-44 |
15 |
45,5 |
7 |
21,1 |
11 |
33,3 |
33 |
|
45-49 |
32 |
55,2 |
12 |
20,7 |
14 |
21,1 |
58 |
|
50-54 |
30 |
55,6 |
10 |
18,5 |
14 |
25,9 |
54 |
|
55-59 |
17 |
46,0 |
10 |
27,0 |
10 |
27,0 |
37 |
|
60-64 |
22 |
50,0 |
4 |
9,1 |
18 |
40,9 |
44 |
|
65-69 |
12 |
52,2 |
6 |
26,9 |
5 |
21,7 |
23 |
|
70-74 |
7 |
43,8 |
3 |
18,8 |
6 |
37,5 |
16 |
|
75-79 |
8 |
53,3 |
2 |
13,3 |
5 |
33,3 |
15 |
|
80 y más |
8 |
47,1 |
4 |
23,5 |
5 |
29,4 |
17 |
*Source: own estimation.
As can be seen in each of the three categories; women represent two-thirds of the subjects.
Figure 1. The tendency of normal, prediabetic, and diabetic states.
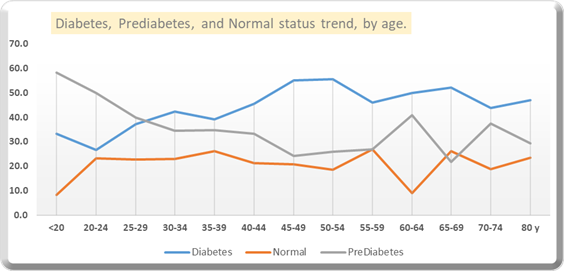
Source: own estimation.
Type 2 Diabetes state tends to increase until the age of 54 and then remains stable. The pre-diabetic state tends to decrease by age. This information can be useful to work on pre-diabetics to prevent them from developing diabetes.
Table 4 Statistically significant variables associated with Diabetes mellitus.
|
Variables |
Coefficients |
Standard E. |
DF |
t value |
Pr > [t] |
|
Intercept |
4.5578 |
0.6899 |
415 |
6.61 |
< 0.0001 |
|
Diastolic P. |
-0.0134 |
0.0062 |
415 |
-2.16 |
0.0314 |
|
HDL |
-0.0107 |
0.0027 |
415 |
-3.92 |
0.0001 |
|
Arterial index |
-0.0200 |
0.0102 |
415 |
-1.95 |
0.0520 |
|
Alcohol consumption |
-0.04357 |
0.2114 |
415 |
-2.06 |
0.0399 |
|
Systolic P. |
0.0126 |
0.0057 |
415 |
2.21 |
0.0275 |
|
LDL |
0.0073 |
0.0017 |
415 |
4.28 |
< 0.0001 |
|
Fruit consumption |
1.0679 |
0.2921 |
415 |
3.66 |
0.0003 |
*Source: own estimation.
These findings indicate a positive relationship between glycated haemoglobin and systolic blood pressure, blood LDL concentration, and fruit consumption. These variables tend to increase the level of glycated haemoglobin in the blood. On the other hand, variables such as diastolic pressure, HDL blood concentration, arterial index, and alcohol consumption, tend to decrease it.
The variables evaluated that did not show statistical significance were total cholesterol, triglycerides, weight, height, abdominal circumference, hip circumference, age, sex, physical activity, marital status, race/ ethnicity, educational level, socioeconomic status, and income.
Discussion
The risk factors associated with increased probability of occurrence of Type 2 diabetes mellitus were systolic blood pressure (β = 0.0126, 90 % CI 0.0015, 0.0237), blood LDL concentration (β = 0.0073, 90 % CI 0.004, 0.0106) and fruit consumption (β = 1.068, 90%CI 0.4955, 1.6405). On the other hand, the factors associated with decrease probability of occurrence were diastolic blood pressure (β = -0.0134, 90 % CI -0.0550, -0.0096), blood HDL concentration (β = -0.0110, 90 % CI -0.0160, -0.0106), the Arterial Index (β = -0.0199, 90 % CI -0.0399, -0.001) and alcohol consumption (β = -0.436, 90 % CI - 0.8500, -0.0214).
Type 2 diabetes is a serious chronic disease that results from a complex genetic-environment interaction, together with other risk factors such as obesity and a sedentary lifestyle. Its complications constitute a major global public health problem, affecting almost all developed and developing countries with high rates of diabetes-related morbidity and mortality.
A study carried out in China, reported that factors such as hypertension, age, obesity and hyperuricemia, and cholesterol, increased the risk of diabetes occurrence, while factors such as HDL and LDL decreased this probability [15]. It is worth highlighting the coincidence among some reported factors, for example, in our case, systolic arterial hypertension increased the probability of the occurrence of diabetes, while diastolic decreased it, although, it was not reported in the same way. In our study, the blood concentration of DLD decreased the probability, while the LDL increased it.
Similarly, in China, another study reported that age, obesity, total cholesterol, triglycerides, hypertension, living in rural areas, and a family history of diabetes were risk factors for prediabetes and diabetes [16].
A systematic review in Nigeria reported the risk factors associated with type 2 diabetes prevalence were a family history of type 2 diabetes (4.6 %; 95 % CI: 3.5–5.6); living in an urban area (6.0 %; 95 % CI: 4.3–7.8); unhealthy eating habits (8.0 %; 95 % CI: 5.4-10.5); smoking (4.4 %, 95 % CI: 1.3-10.2); older age (6.6 %, 95 % CI 4.5 to 8.7); physical inactivity (4.8 %, 95 % CI 3.2 to 6.4); and obesity (5.3 %, 95 % CI 3.8 to 6.9) [17]. None of these factors was found to be associated with diabetes in our study.
The risk factors significantly associated with diabetes reported in Ghana were, a family history of diabetes (OR 3.46 95 % CI: 2.50- 4.78), physical inactivity (OR 3.06 95 % CI 1.66–5.64), and age ≥ 40 years (OR 2.36 95 % CI: 1.77-3.16) [18]. None of these factors was found in our study.
Alcohol consumption has been reported to interfere with the release of glucose from the liver. This organ can release glucose from stored glycogen, and it is capable of degrading 0.1 grams of alcohol per kilogram of weight per hour. This slow elimination of alcohol means that if you drink alcohol at night or in the late afternoon, the risk of nocturnal hypoglycaemia is high [19]. An opposite result was found in this study.
Studies carried out in Argentina and Mexico reported that the elevated arterial index was associated with an increase in insulin resistance [20,21]. These results were contrary to what was found in this study. Regarding the consumption of fruits, a systematic review found that an increase in the consumption of fruits with a low Glycaemic Index produces a release of fructose, six or more grams, from the small intestine into the blood circulation for a prolonged period, leading to a reduction in postprandial blood glucose levels. A very different situation occurs with high consumption of fructose, 17-25 % of the dietary energy intake, which increases the risk of diabetes and cardiovascular disease [22].
In Sweden it was reported that participants born in Sweden found a higher risk of developing type 2 diabetes than those born in Asia (OR 3.2, 95 % CI 2.2 to 4.7), Sub-Saharan Africa (OR 2.5, 95 % CI 1.5 to 4.1), and North Africa / Middle East (OR 2.1, 95 % CI 1.6-2.8), after an adjustment for established risk factors [23]. These factors were not explored in our study, despite the fact that the region where the study was carried out is a pole of attraction for other national communities.
Recently, other factors such as environmental toxins that act as endocrine-disrupting chemicals (EDCs) have emerged as new metabolic disease risk factors. EDCs implicated in the pathogenesis of diabetes include various organic and inorganic molecules, both natural and synthetic in origin. Differential exposures to diabetic EDCs likely also contribute to racial/ethnic and economic disparities.
Despite these emerging links, clinical practice guidelines do not address these underestimated risk factors for type 2 diabetes [24].
Factors such as a healthy diet have been found to be associated with lower systolic and diastolic blood pressure among men and lower fasting plasma glucose among men and women. The same diet was inversely associated with abdominal obesity for the upper quartile, with an OR 0.68 95% CI, 0.48-0.96, hypertension OR 0.50, 0.31-0.81, and type 2 diabetes OR 0.38, 0.18-0.80, among men [25].
Another study reported that regular physical activity significantly improved participants' physical fitness and quality of life [26].
A study carried out in Sweden in order to measure the incidence of type 2 diabetes associated with different anthropometric measures, reported that all obesity measures were associated with a substantially higher incidence of diabetes. Abdominal obesity was associated with higher incidence rates in men than in women, but in terms of relative risks, the relationships were stronger in women. The combination of measures of BMI and abdominal obesity had a stronger association with diabetes than BMI alone [27].
The complex interaction between genetic and environmental components that cause type 2 diabetes, and therefore, the identification of the factors associated with its occurrence continues to be a major challenge for medical science. Up to the point that the focus on research in this field has been reoriented towards the identification of the mechanisms by which the recognized risk factors promote the appearance of type 2 diabetes in some individuals [28]. The Public Health usefulness of the factors found to be associated with type 2 diabetes, reported by this study, is that can be used in health service networks as a guide to be developing a screening test that detects early apparently healthy people. Those exposed to these factors might increase their probability of getting sick. Therefore, these factors should be identified and intervened to reduce that probability.
On the other hand, those factors identified as protective such as the blood concentration of HDL should be promoted to try to keep people healthy or at least to delay the occurrence of type 2 diabetes, as long as possible. Special care must be taken with factors such as systolic blood pressure, arterial index, and alcohol consumption which, although found to be positively associated with the occurrence of type 2 diabetes, should be taken into account that the lower blood pressure and arterial index figures remain, the better for people. Regarding alcohol consumption, it must also be taken into account that the glycaemic-lowering effect is due to an undesirable interference on the intrinsic mechanisms in the liver.
Nevertheless, we know from the body of accumulated knowledge, that the lower the three factors identified as aggressors for people's health, such as diastolic pressure, blood LDL concentration, and fruit intake with a low Glycaemic Index, the better for people’s health. Regarding fruit consumption, we must find the right balance in order to avoid the opposite effect with its intake, named as a nutritional paradox.
It is well known that improving the type 2 diabetes situation depends not only on a deeper understanding of disease risk factors, and the effectiveness of available interventions, but also on the recognition of the interaction of biological, social, behavioral, and environmental determinants [29].
Study limitations
Even though they have been validated in other similar settings, the reliability, and consistency of the measurement instruments must be highlighted. In addition, the observer's error, in this case, the interviewer's errors in the field and errors attributable to participating individuals in the study, give reason to note that a generalization of these findings unto other contexts or populations is complex, in addition to other variables, reported in scientific literature as important, which were not collected.
Another important limitation is the cross-sectional design of this study, which imposes certain limitations on causal inference. For instance, if the occurrence of diabetes was due to a large extent, to the interaction between genetic and environmental factors, the cumulative deleterious effects of complex social processes throughout the course of a lifetime, these phenomena would be better understood if they were studied Longitudinally [30].
Ethical aspects: The Institutional Committee for Human Ethics (CIREH) of the School of Public Health at Universidad Del Valle approved the protocol in September 2016.
Conflict of interest: None declared by the authors.
Acknowledgments
Thank you to the Center for the Development and Evaluation of Public Information Policy and Health Technology (CEDETES) of the Universidad Del Valle, for granting us access to the resulting database from the Survey done on Risk Factors for Non-communicable Diseases in Cali.
References
- Informe mundial sobre diabetes (2016) World Health Organization.
- Análisis de Situación de Salud (ASIS). Dirección de Demografía y Epidemiologia. Bogotá, 2019.
- Global burden of 87 risk factors in 204 countries and territories, 1990–2019: a systematic analysis for the Global Burden of Disease Study 2019. The Lancet. 396(10258): 1223-1249.
- Wu Y, Ding Y, Tanaka Y, Zhang Z (2014) Risk Factors Contributing to Type 2 Diabetes and Recent Advances in the Treatment and Prevention. Int. J. Med. Sci.11(11): 1185-200.
- International Diabetes Federation. IDF Diabetes Atlas. 2013.
- Peter P, Lipska K (2016) The rising cost of diabetes care in the USA. Lancet Diabetes Endocrinol.4(6): 479–480.
- All About Your A1C.
- Palta M (2003) Quantitative Methods in Population Health: Extension of Ordinary Regression. John Willey & Sons, Inc. USA. ISBN 0-471-45505-9
- Kleinbaum DG, Kupper LL, Muller KE, Nizam A (1988) Applied Regression Analysis, and Other Multivariable Methods. Wadsworth Publishing Company. Second edition. ISBN 0- 87150-123-6.
- Ryan TP (2013) Sample Size Determination and Power. Wiley Series in Probability and Statistics. New York: John Wiley & Sons, Inc. New Jersey. ISBN 978-1-118-43760-5.
- Rothman KJ (1986) Modern Epidemiology. Little, Brown, and Company. Boston. ISBN 0-316-75776-4.
- Oliveira AG (2013) Biostatistics Decoded. John Willey & Sons, Ltd. The United Kingdom. ISBN 978-1-119-95337-1.
- SAS Institute Course Notes (1996). Advanced General Linear Models with an Emphasis on Mixed Models, SAS Institute Inc.
- SAS Institute Inc., 2019.
- Han Y, Zhang S, Chen S, Zhang J, Guo X, et al. (2020) Incidence and risk factors of type 2 diabetes mellitus in individuals with different fasting plasma glucose levels. Ther Adv Endocrinol Metab.11(1): 1–9.
- Hu Y, Teng W, Liu L, Chen K, Liu L, et al. (2015) Prevalence and Risk Factors of Diabetes and Diabetic Retinopathy in Liaoning Province, China: A Population-Based Cross-Sectional Study. PLoS ONE 10(3): e0121477.
- Uloko AE, Musa BM, Ramalan MA, Gezawa ID, Puepet FH , et al. (2018) Prevalence and Risk Factors for Diabetes Mellitus in Nigeria: A Systematic Review and Meta-Analysis. Diabetes Ther. 9(3): 1307–1316.
- Asamoah-Boaheng M, Sarfo-Kantank O, Tuffour AB, Eghan B, Mbanya JC (2019) Prevalence and risk factors for diabetes mellitus among adults in Ghana: a systematic review and meta- analysis. Int Health. 11(2): 83–92.
- González EC, Herrera JL, Fernández CRG, Ros LMF (2016) Relación entre pacientes con diagnósticos de Intoxicación por bebidas alcohólicas y presencia de hipoglucemia. Revista Habanera de Ciencias Médicas. 15(4):599-609.
- Hernández-Vite Y, Elizalde-Barrera CI, Flores-Alcántar MG, Vargas-Ayala G, Loreto-Bernal ML (2015) Asociación entre el índice triglicéridos/colesterol HDL y la glucosa alterada en ayuno en pacientes normo tensos con obesidad y sobrepeso. Med Int Méx. 31(5): 507-515.
- Agüero SD, Piña EC, Pérez MA (2012) Alimentación y diabetes. Nutr Hosp.27(4): 1031-1036.
- Carvallo P, Carvallo E, Barbosa-Da-Silva S, Mandarim-De- Lacerda CA, Hernández A, et al. (2019) Efectos metabólicos del consumo excesivo de fructosa añadida. Int. J. Morphol. 37(3):1058-1066.
- Elinder LS, Hakimi SN, Lager A, Patterson E (2016) Increased type 2 diabetes risk in migrants to Sweden from Asia, Africa, and the Middle East: Liselotte Schafer. Ninth European Public Health Conference: Parallel Sessions.26(1).
- Sargis RM, Simmons RA (2019) Environmental neglect: endocrine disruptors as underappreciated but potentially modifiable diabetes risk factors. Diabetologia. 62(10): 1811– 1822.
- McNaughton SA, Dunstan DW, Ball K, Shaw J, Crawford D (2009) Dietary Quality Is Associated with Diabetes and Cardio- Metabolic Risk Factors. J. Nutr.139(4): 734–742.
- Gusi N, Hernandez-Mocholi MA, Olivares PR (2015) Changes in HRQoL after 12 months of exercise linked to primary care are associated with fitness effects in older adults. European Journal of Public Health. 25(5): 873–879.
- Borne Y, Nilsson PM, Melander O, Hedblad B, Engstrom G (2015) Multiple anthropometric measures in relation to incidence of diabetes: a Swedish population-based cohort study. European Journal of Public Health. 25(6): 1100–1105.
- Delgado D, Bergonzoli G (2020) Mechanisms Associated with Type 2 Diabetes Occurrences: Structural Equation Confirmatory Model. Arch Diabetes. 2(1): 01-12.
- Chiuve SE, Cook NR, Shay CM, Rexrode KM, Albert CM, et al. (2014) Lifestyle-based prediction model for the prevention of CVD: The healthy heart score. J Am Heart Assoc.3(6): 1–12.
- Obesity in China: time to act (2021) Editorial. The Lancet Diabetes & Endocrinology. 9(7): 407.