


Kangwende C1*, Ajeneye F2, Nkansah E1, Chabva-Shoperai A1, Adelusi M1, Tanwair N1, Baines S3
1Department of Haematology, Princess Alexandra Hospital NHS Trust, United Kingdom CM20 1QX
2Department of Blood Transfusion, Princess Alexandra Hospital NHS Trust, United Kingdom CM20 1QX
3School of Life and Medical Sciences , University of Hertfordshire, UK
*Corresponding Author: Kangwende C, Department of Haematology, Princess Alexandra Hospital NHS Trust, United Kingdom CM20 1QX.
Abstract
The storage procedure of EDTA blood samples within a laboratory is incredibly important as correct sample storage can minimise the haematological and biochemical changes that take place due to the inevitable deterioration of the red blood cells (RBC). It also prevents bacterial contamination and protects the integrity of the sample ensuring that the results are accurate and reliable. The aim of this study was to monitor and evaluate the storage of Ethylenediaminetetraacetic acid (EDTA) blood samples and how it can directly affect some haematology parameters and interpretation when stored at 20-25°C and 2-4°C, over a set period. Forty EDTA blood samples were selected from adult subjects by convenient sampling between the period of March and May 2023. This study recruited 40 participants which were predominantly adults with an average median age of 23 years.
The samples were analysed using the Sysmex XN-1000 haematology analyzer for Full Blood Count (FBC) including a five-part differential leukocyte count (DLC) at 12, 24, 36, 48 and 72 h intervals. The results were recorded onto excel and entered on to SPSS statistical programme to run a paired t-test analysis. It was found that white blood cell (WBC) count, red blood cell (RBC) count, haemoglobin (HGB) and mean corpuscular haemoglobin (MCH) remained stable in both conditions. However, the mean corpuscular volume (MCV) and the red cell distribution width (RDW) increased over the 72-h period due to the swelling of red blood cells and the mean corpuscular haemoglobin concentration (MCHC) decreased due to the significant steady increase of haematocrit (HCT), each with a p-value of <0.05, when stored at 20- 25°C. The refrigerated samples showed no statistical significance in MCV, RDW, MCHC or HCT, maximising the stability of the parameters.
The platelet count (PLT) was found to decline in both storage conditions (p-value=<0.05). No statistical significance was observed in the number of neutrophils (NEUT), lymphocytes (LYMPH) and eosinophils (EO), each parameter having a calculated p-value of >0.005. Statistical significance was found in Monocytes (MONO) and basophils (BASO) at 72 h of storage at 20-25°C. No statistical difference found in NEUT, LYMPH, EO or MONO when refrigerated (pvalue = >0.05) but difference was found in BASO, p-value= 0.00.
Keywords: Full blood count, sample storage, EDTA, Sysmex, Differential count, SPSS, haematology parameters
Introduction
Haematology testing can provide crucial information that can be used for the diagnosis and management of conditions and diseases that affect the blood and its components, namely inflammation, infections, anaemia, and blood disorders. Haematology tests include Full Blood Count (FBC) which is an indicator of the number of red blood cells, white blood cells, and platelets in the body.
The most requested tests are full blood count and Differential count. The storage of samples is crucial because it can have an irreversible impact on the biological material if not stored appropriately. Correct storage of samples minimises the deterioration of the material which ensures sample viability, does not compromise the integrity of the sample, and prevents unwanted contamination [1]. This allows for the sample to be used or investigated for further testing after a certain period after its initial collection. The Princess Alexandra Hospital, the routine haematology department receive on average of 1200 ethylenediamine tetra-acetic acid (EDTA) samples a day (K3EDTA is an anticoagulant which prevents the blood samples from clotting before testing [2]. These samples come from within the hospital such as theatres, wards, Accident and Emergency (A&E), and from local General Practitioners (GPs). When the samples arrive in the laboratory, the patient information on the label is checked to ensure that there are three identifiers – Full name, Date of Birth and Hospital/NHS number. Samples are rejected if one of the three identifiers is missing. Following testing, the samples are tracked by the laboratory’s Sysmex tube sorter and are stored at room temperature for a minimum of five to seven days depending on the workload. Though blood samples are stored for up to 7 days, the samples are only viable for up to 24 hs for most haematology parameters [3]. Ideally, blood films must be made as soon as possible due to changes that occur because of the anticoagulant [4]. However, these samples will need to be stored 2-4°C to maintain the stability of the sample. All samples that arrive to the laboratory after 24 hs will not be suitable and phoned to the requesting clinician for a repeat. This is not a desirable outcome for the clinician or their patient as their patient will most likely have to be bled again which causes a delay in results, diagnosis and treatment. This is why it is important to appropriately store blood samples in a manner that preserves it as much as possible to prevent such outcomes and to maintain accuracy of results. The aim of this research is to monitor and evaluate the storage of 40 adults EDTA blood samples at ambient temperature (20-25°C) and at 2-4°C at intervals of 12, 24, 36,48, and 72 hs and how it can directly affect haematology parameters interpretation. Understanding how the Full blood count and Differential leukocyte count are affected when stored over a certain period (and whether the affects can be minimised), will help in the understanding of why there are certain procedures in place such as rejecting samples that have arrived at the laboratory after 24 hs and why samples that require further investigation after initial testing should be stored at 2-4°C. The findings of this research will be used to further support our standard operating procedures that are already in place for the storage of samples and add-on tests at the Princess Alexandra Hospital and to evaluate whether there is any potential for improvement. [5] emphasized that the refrigeration of blood samples minimises the effects of deterioration of certain FBC parameters and overall maintains the stability of haematology parameters.
Materials and Methods
Evaluation of the effects on sample storage on haematology interpretation was completed using 40 Ethylenediaminetetraacetic acid (EDTA)– anticoagulated blood samples that were selected from the Princess Alexandra Hospital routine haematology workload over the course of 3 weeks. The samples came from adult men and women by convenient sampling. Results of the samples after initial arrival into the laboratory (0 hs) were examined to ensure sufficient selection of abnormal and normal values. 20 of the 40 samples selected had normal results where the parameters of the FBC and Differential Count fell within the haematological reference ranges. Using a disposable pipette, 10 samples were aliquoted into labeled paediatric tubes, each tube containing 500μL of blood. 5 of the 10 tubes were to be stored at ambient temperature, 20-25°C, and the other 5 to be refrigerated at 2-4°C over the study period. Each paediatric tube was to be tested at 12, 24, 36, 48 and 72 hs. Both conditions are regulated and maintained 24/7 appropriately through temperature monitoring. Each aliquot was run manually using the Sysmex XN-1000 automated haematology analyser for Full Blood count and Differential Leukocyte Count. The samples were inverted 20 times and clot checked using orange stick before being loaded on to the analyser, in line with the laboratory’s Standard Operating Procedure for manual testing of paediatric samples to ascertain adequate mixing of the blood and to prevent inaccurate readings due to the presence of blood clots. The following parameters of the full blood count were chosen to be monitored: white blood cell (WBC) count, red blood cell (RBC) count, haemoglobin (HGB), haematocrit (HCT), mean corpuscular volume (MCV), mean corpuscular haemoglobin (MCH), mean corpuscular haemoglobin concentration (MCHC), red cell distribution width (RDW) and platelet (PLT) count. The differential leukocyte count is the number and percentage of neutrophils (NEUT), lymphocytes (LYMPH), monocytes (MONO), eosinophils (EO) and basophils (BASO) which are different types of WBC. There are other full blood count parameters that the haematology XN-1000 analyser generates, however the above parameters were chosen to be monitored in this study.
The Sysmex XN-1000 analyser use different methods for the measurement of haematology parameters. The principle of measurement for RBC and PLT is hydrodynamic focusing. Fluorescent flow cytometry is used for the measurement of WBC and differential leukocyte count. Non-cyanide SLS haemoglobin is used for HGB, and cumulative pulse height detection is used for the measurement of HCT. To maintain the accuracy of results and performance of the XN-1000 analyser, internal quality controls are run at 00:00, 09:00 and 15:00 by the laboratory staff. There are different levels of the quality controls provided by the manufacturer to cover a wide clinical range. Level 1 which covers the abnormal low values, level 2 which covers normal values and level 3 which covers the abnormal high values according to the Sysmex guide.
The results of the samples were printed from the XN-1000 information system and inputted onto an excel spreadsheet. All data was double checked for typo errors.
Statistical analysis
Once all the data was collected, it was entered onto statistical software SPSS to run a paired t-test analysis where the paired mean difference between the mean initial value and the mean value at each interval was calculated. It also provided the 95% confidence interval and calculated two-sided p-values. A p-value <0.05 would indicates that the mean difference between the paired values are statistically significant. The mean percent change from initial sample value (0 hs) was plotted with the 95% confidence interval against time in hs on excel.
Results
The mean percent change for each parameter was plotted against time in hs along with its 95% confidence interval (CI). WBC, RBC, HGB, MCH remained stable throughout the 72 hs at ambient temperature (Figure 1).
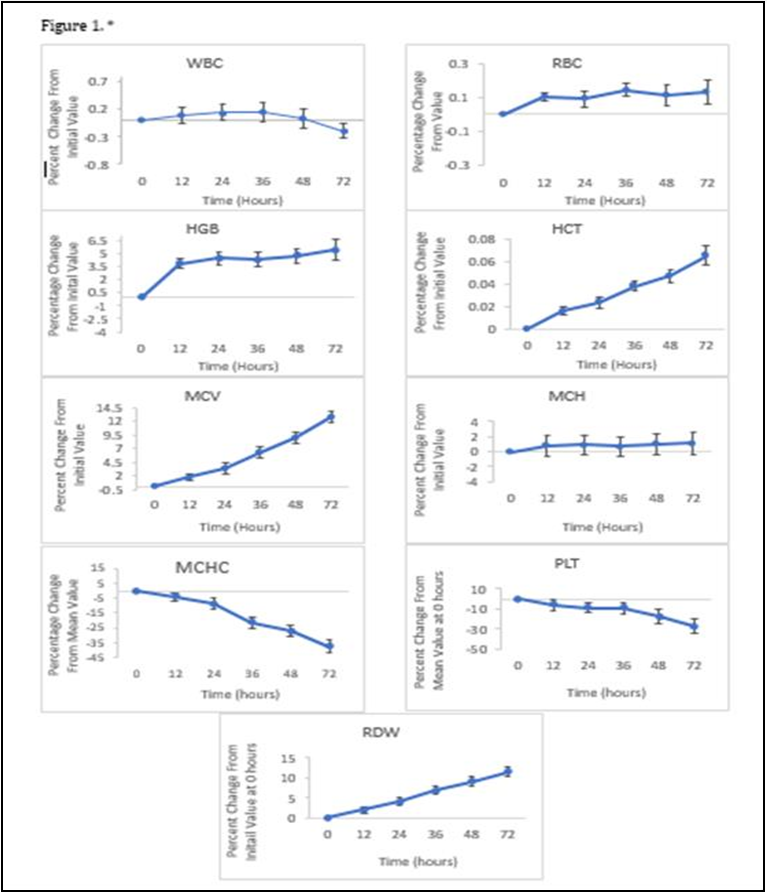
The mean percent change remained just under 1.1 for WBC, RBC, MCH With the 95% Confidence interval ranging from -0.2 +2.9%. The mean percent change for HGB at 72hs was 5.4 points higher than the initial value at 0 hs with a 95% Confidence interval of+4.16% to +6.69%. At 2-4°C, the WBC, RBC and MCH remained stable with a mean percent change of 0.2, 0.1, 1.3 respectively with a combined 95% confidence interval ranging between -0.2% to +2.9%. For HGB the maximum mean percent change was 5.0 with the 95% confidence interval ranging from +3.2% to +5.9%. Overall, there were no differences that were clinically significant in both storage conditions for these parameters. The MCV and RDW increased over the 72-h period when stored at ambient temperature. At 72 hs, the mean percent for MCV was 12.7 with the 95% confidence intervals ranging from +1.06% to +13.77% and for RDW, the mean percent was 11.5 with the 95% confidence intervals ranging from +1.23% to 12.69%. Both parameters had a calculated p-valueof <0.05 when stored at 20-25°C, when stored at 2-4°C, the MCV and RDW remained stable, with a mean percent change of 1.7and -0.5 respectively. The 95% confidence intervals ranged from -0.4% to +2.6% for MCV and -2.3% to +2.1% for RDW throughout the 72-h period when the blood sample was refrigerated. The HCT also showed a small increase over a period of time, the value recorded at 72 h being 0.06 points higher than the initial value and a 95% confidence interval of +0.01% to +0.1%. Both parameters had a calculated p-value of >0.05 when refrigerated at 2-4°C. When stored at ambient temperature, the MCHC decreased at each interval with the maximum mean percent change of -37.0, the 95% confidence intervals ranging from -42.6% to -1.3% and a calculated p-value of <0.05 when stored at 20-25°C. However, similarly to the MCV and RDW, the MCHC in the refrigerated samples remained stable with the maximum mean percent change of 8.3 at 48 hs, the 95% confidence intervals ranging from -9.3% to +22.0% over the 72-h period and a p-value of 0.7 which is above 0.05 displaying no statistically significant difference in the mean percent value from the initial value at 0 hs. The mean percent change for the PLT count began to immediately decrease with the value being -5.8 at 12 hs and -27.6 at 72 h. The 95% confidence interval ranged from -35.0% to + - 0.03%. When stored at 2-4 °C the mean percent value was - 19.7 at 12 hs and -27.3 and 72 hs with 95% confidence intervals ranging from -33.5% to -4.6%. Though there are statistically significant differences in PLT values in both storage conditions with calculated pvalues of <0.05, there is no clinically significant difference. There were no statistically significant differences seen in the number of NEUT, LYMPH and EO within the 72-h period at ambient temperature, with the maximum percent change remaining under 1 for each parameter at each interval (Figure 2).
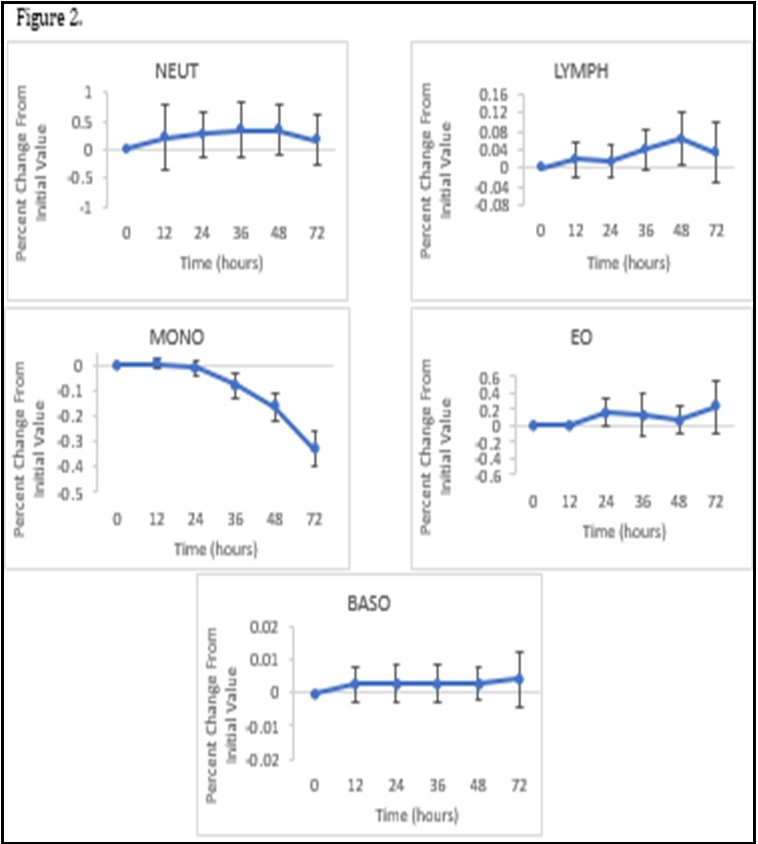
The 95% confidence interval ranged between -0.4% to +0.8%. The calculated p-values at 72 hs when stored at 20-25°C are as follows: Neutrophils p-value = 0.46, Lymphocytes p-value= 0.35, Eosinophils p-value = 0.16. For Monocytes, there was no statistically significant difference found at 12 or 24 h but the decrease from the initial value at 72 hs had a calculated p-value of 0.00 when stored at 20-25°C, making it statistically significant. For Basophils there was no statistically significant difference at 12 h but after 24 h the calculated p-value decreased from 0.13 to 0.03. AT 72 h the calculated p-value was 0.04 when stored at 20-25°C. Though these two parameters showed statistical significance, overall, there is no clinically significant difference. The specimens that were refrigerated for NEUT, LYMPH, MONO and EO were found to be more stable, all with a calculated p-value >0.05, showing no statistical significance and the 95% confidence intervals ranging between -0.2% to +0.8%. However, there was an increase in the18 mean percent for basophils which showed statistical significance from 12 h with a p-value of 0.00 for each interval.
Discussion
Among the full blood count parameters, the WBC, RBC, HGB, and MCH remained stable at both ambient temperature and at 2-4°C, over the 72-h. De [6], published findings that support the stability of these parameters with no significant variation of the mean values in both conditions. The MCV at ambient temperature began to increase just after 24 h with an overall percentage increase of 13% at 72 h. The wide 95% confidence intervals display the instability of the MCV and the calculated p-value of <0.05 shows that the mean percent change is statistically significant. The MCV is a known haematology parameter to be unstable at 20-25°C and it has been reported and supported by other literature studies. [7], reported MCV increasing at a fast rate within the first 4 days of storage at room temperature. [8] previously reported an increase in the MCV after overnight storage at 23°C.
This change occurs due to the sodium potassium membrane leak of the red blood cells. The leak causes the solute concentration outside of the red blood cells to increase due to the re-distribution of monovalent cations [9]. In the body, some of the cations e.g., miron, would be regulated through iron haemostasis and reutilised through iron recycling [10] but because that regulation does not occur outside of the body, the cations remain in the plasma which causes the movement of water into the red blood cells via osmosis. This causes the cells to swell and eventually burst. The swelling of the red blood cells is what will cause the increase in mean corpuscular volume which is the measurement of the average size of red blood cells. HOPS is the investigation for genes that affect the quality or quantity of haemoglobin. The successful detection of a haemoglobinopathy involves a “3 tier diagnostic work up”, the first tier being the assessment of the FBC results. A low MCV or MCH is a good indicator for Thalassemias– a type of haemoglobinopathy- and iron deficiency [11,12]. Therefore, to prevent the increase of MCV due to storage and to minimise its instability, it is recommended that blood samples that require HOPS testing are refrigerated at 2-4°C [4]. If a sample is not appropriately stored prior to testing, then there is a chance that the MCV value would have increased. This could lead to the mis-diagnosis of an inherited blood disorder. The increase of MCV values due to storage can affect samples that already have an initial value that is close to the upper or lower reference range of the parameter. This is not desirable as a sample that has a MCV value below 70fL, which would be an indication of microcytic anaemia, would increase over time into the reference range which could cause that sample to be overlooked and not further investigated, putting the patient at risk. This is the same for samples that are just within the upper reference range (>96fL) as it would cause the sample to fall out of range with an abnormal result and mimic a diagnosis of polycythaemia. This would be cause for further investigation that would not have been needed initially if the sample was tested within the 24-h window are stored appropriately. The Red blood cell distribution width is another parameter that is known to increase over time when stored at 20-25 °C. The overall percentage increase at 72 h from the initial value was 24%. However, the overall percentage increase 72 h after collection when refrigerated at 2- 4°C was 1.1%. This is further supported by [5], who also found significant increases in the RDW when stored at 23°C but not at 4°C. The RDW is the measurement of the range of sizes of RBC in the blood, so when the swelling of RBC’s occurs, this causes an increase in RDW because there are more RBC’s that are larger than what would be considered normal. Studies have shown that overtime the MCHC will decrease when stored at 20-25°C which is also evident in the data collected in this research. Overall, at 72 h there was an 11% decrease from the initial value at 0 h. The 95% confidence intervals ranged from -42.6% to -1.3% over the 72-h period displaying the parameters instability and a calculated p-value of <0.05 showing that the decrease is significant. MCHC is calculated using the following formula MCHC (g /L) = HGB ÷ HCT. Haematocrit increased over the 72-h period with a p- value of 0.00. An increase in HCT causes the MCHC to decline. In this research the platelet count decreased in both conditions with a calculated p value of <0.05 which means that there is a significant difference in the mean percent change. However, there is no clinically significant difference. There are studies that report the findings of statistical significance such as [13], but other studies report the platelet count remaining stable for up to 4 days and not finding any significant differences [6]. Though most of the Full blood count parameters remain stable throughout the 72-h period [1]. It is not recommended for a FBC to be run on a blood sample after 24 h due to the process of deterioration of the MCV, RDW and MCHC. There are studies that 20 investigate the morphological changes in peripheral blood smears in samples that are stored at ambient temperature and refrigerated at 4°C. [13] also reported that there are changes in cells that are seen as early as 2 h after blood collection and the changes become more conspicuous after 6 h. This further supports the inevitable breakdown of blood components within the first 24 h of blood collection.
Limitations
If this research were to be repeated, improvements that would be made would be to use a larger sample size and longer period sample collection to mimick variation of weather condition and changes during sample transportation, to get a better representative of the population and to cover a wider range of temperature conditions such as monitoring samples stored in the freezer or stored above 25°C to investigate the changes in the full blood count and differential leukocyte parameters. Additionally, it would be beneficial to extend the storage time of the samples to further evaluate the effect of storage on FBC and DLC parameters e.g., 96 h and 120 h. It would be interesting to evaluate the effects of storage more haematological parameters not covered in this study.
Conclusion
In conclusion, this data shows and supports other related literature studies that the majority of the full blood count parameters remain stable over the 72-h period at ambient temperature, 20-25°C. It also supports studies that reported the mean corpuscular volume, the red cell distribution width and mean corpuscular haemoglobin concentration to be unstable at 20-25°C. The stability of all FBC and DLC parameters are better maintained when refrigerated at 2-4°C, retaining the true values of the sample. If a sample is needed for further investigation, e.g., Haemoglobinopathy screening or for a special test that needs to be sent away, after the full blood count and differential leukocyte count has been run then it is advised that the specimen is to be kept refrigerated at 2-4°C. If further investigation is required, then the sample should be run within the first 24 h of collection. However, if this exceeds 24 h then a comment is put on the patient results file that lets the clinician know there are technical issues regarding the requested test.
Declaration of competing interest: The co-authors do not have any conflict of interest to declare.
Acknowlegment: The University Of Hertfordshire, College Lane, AL10 9AB
References
- Joshi A, McVicker W, Segalla R, Favaloro E, Luu V, et al. (2015) Determining the stability of complete blood count parameters in stored blood samples using the SYSMEX XE- 5000 automated haematology analyser. International Journal of Laboratory Hematology. 37(5): 705–714.
- Recommendations of the International Council for Standardization in Haematology for Ethylenediamine tetra-acetic Acid Anticoagulation of Blood for Blood Cell Counting and Sizing. International Council for Standardization in Haematology: Expert Panel on Cytometry. Am J Clin Pathol. 1993. 100(4): 371-2.
- Akorsu EE, Adjabeng LB, Sulleymana MA, Kwadzokpui PK (2023) Variations in the full blood count parameters among apparently healthy humans in the Ho municipality using ethylenediamine tetraacetic acid (EDTA), sodium citrate and lithium heparin anticoagulants: A laboratory-based cross- sectional analytical study. Heliyon. 9(6): e17311.
- Wood BL, Andrews J, Miller S, Sabath DE (1999) Refrigerated Storage Improves the Stability of the Complete Blood Cell Count and Automated Differential. American Journal of Clinical Pathology. 112(5): 687–695.
- Unalli O, Ozarda Y (2021) Stability of hematological analytes during 48 h storage at three temperatures using Cell-Dyn hematology analyzer. Journal of Medical Biochemistry. 40(3): 252–260.
- de Baca M.E, Gulati G, Kocher W, Schwarting R (2006) Effects of Storage of Blood at Room Temperature on Hematologic Parameters Measured on Sysmex XE-2100. Laboratory Medicine. 37(1): 28–36.
- Gulati G.L, Hyland L.J, Kocher W, Schwarting R (2002) Changes in Automated Complete\Blood Cell Count and Differential Leukocyte Count Results Induced by Storage of Blood at Room Temperature. Archives of Pathology & Laboratory Medicine. 126(3): 336–342.
- Lawrence AC, Bevington JM, Young M (1975) Storage of blood and the mean corpuscular volume. Journal of Clinical Pathology. 28(5): 345–349.
- Flatt JF, Bawazir WM, Bruce LJ (2014) The involvement of cation leaks in the storage lesion of red blood cells. Frontiers in Physiology. 5: 214.
- Wallace DF (2016) The Regulation of Iron Absorption and Homeostasis. The Clinical Biochemist. Reviews. 37(2): 51–62.
- Trent RJ, Webster B, Bowden DK, Gilbert A, Holl PJ, et al. (2006) Complex phenotypes in the haemoglobinopathies: recommendations on screening and DNA testing. Pathology. 38(6): 507-19.
- Bryant B.J, Hopkins J.A, Arceo S.M, Leitman S.F (2009) Evaluation of low red blood cellmean corpuscular volume in an apheresis donor population. Transfusion. 49(9): 1971–1976.
- Narasimha A, Kumar H, Prasad C.S.B.R (2008) Anticoagulant induced artefacts in peripheral blood smears. Indian Journal of Hematology and Blood Transfusion. 24(2): 43–48.
- Pintér E, László K, Schüszler I, Konderák J (2016) The stability of quantitative blood countparameters using the ADVIA 2120i hematology analyzer. Practical Laboratory Medicine. 4: 16–21.
- Sree Ramya D, Nagalakshmi Vijayambika J, Eswari V (2020) Effect of room temperature and refrigerated storage on automated hematological parameters. Indian Journal of Pathology and Oncology. 7(4): 625–630.
- Trent R.J.A (2006) Diagnosis of the Haemoglobinopathies. Clinical Biochemist Reviews. 27(1): 27–38.
- Schapkaitz E, Pillay D (2015) Prolonged storage-induced changes in haematology parameters referred for testing. Afr J Lab Med. 4(1): 208.
- Kayadibi H, Acar IA, Cam S (2020) Stability of complete blood count parameters depends on the storage temperature, storage time, transport position and selected stability criterion. Scand J Clin Lab Invest. 80(6): 470-478.
- Zini G (2014) Stability of complete blood count parameters with storage: toward defined specifications for different diagnostic applications. Int J Lab Hematol. 36(2): 111–113.
- Hedberg P, Lehto T (2009) Aging stability of complete blood count and white blood cell differential parameters analyzed by Abbott CELL-DYN Sapphire hematology analyzer. Int J Lab Hematol. 31(1): 87–96.