


Ramlugun Chandrakiran1, Mohadeb-Somar Jhassu Varsha Naveena2, Somar Mirinal3*
1BDS, Dental Surgeon, Ministry of Health and Wellness, Mauritius
2BDS, MDS, PhD, Dental specialist (Orthodontist), Ministry of Health and Wellness, Mauritius
3BDS, MDS, PhD, Assistant Professor, JSS academy Mauritius, Orthodontist, Private Practice, Mauritius
*Corresponding Author: Somar Mirinal, BDS, MDS, PhD, Assistant Professor, JSS academy Mauritius, Orthodontist, Private Practice, Mauritius.
Abstract
Aim: To evaluate and compare the degree of patient satisfaction between Public Dental Healthcare Centres and Private Dental Clinics in Mauritius. To investigate the components associated with the degree of overall satisfaction from both dental healthcare centers.
Methods: The methodology included sample selection, data collection, and analysis. The sample was selected from public dental healthcare centers and private dental clinics in Mauritius, using a random sampling technique to ensure that the model was representative of the population. Patient satisfaction was assessed using a standardized questionnaire, and data were analyzed using statistical methods to compare the mean scores of patient satisfaction between the public dental healthcare centers and private dental clinics.
Results: It was observed that Patient Satisfaction was higher in Private Dental Clinics than in Public Dental Healthcare Centers. It was noted that in the Public healthcare centers, overall patient satisfaction was positively related to the Dentist's Performance and Non-clinical dental services. No significant correlation was found between Dental assistants' performances in the public sector. In the private Healthcare centers, overall patient satisfaction was positively related to all three aspects: Dentists' performance, Dental assistants' performance, and non-clinical dental services.
Conclusion: The study shows that consumer satisfaction with dental care is influenced by the variables waiting time, availability of care, and demographic characteristics such as gender and age. The most critical factors reflect the dentist's behavior and personal skills in devoting time and attention to the patient.
1. Introduction
Mauritius is a middle-income country offering free public medical care to every one of its 1.2 million residents nationwide. It also boasts a thriving private medical industry. Public health is free and covers 73 % of the population's healthcare needs. The remaining 27 % is catered by the private sector, where treatment is self-funded. For the continuous improvement of the delivery of treatment and outcome, it is essential to have feedback for patient satisfaction regarding dental care.
"Patient satisfaction is an important measure of healthcare quality as it offers information on the provider's success at meeting clients' expectations and is a key determinant of patients' perspective behavioral intention." [1] Patient satisfaction is an essential tool in monitoring the quality of health care. Satisfaction with the care provided indicates the likelihood of the patient continuing to use the healthcare facility and adhere to medical advice and is a determinant of overall care coverage and effectiveness [2]. Onyeonoro et al. describe satisfaction with care as implying the degree of agreement between patients' perception of the consideration received and their expectations from the care relationship.[3]
In the dental field, it can be used to identify the strength and weaknesses of a service. Having patients' perceptions regarding their visit to a dental practice helps to deal with dissatisfactions and complaints, preventing anxiety and stress among dental staff and promoting high standards of professional conduct among the dental team. In this era of clinical governance and patient partnership in delivering high-quality oral healthcare, patients' concerns must be addressed appropriately to improve the treatment quality and help with better future planning.
Researchers observed a considerable difference in the operations, treatments, and services between privately owned institutions and public hospitals. This research would assist in comparing customer satisfaction between public and private care dental treatments through a questionnaire survey and statistical analysis of the survey results. The survey would describe the service gaps, if any, between both public and private sector dental setups across Mauritius.
2. Materials and Methods
This study used a random sampling technique to select patients from both public and private dental care centers in Mauritius. Patients' selection was from 8 different public and 8 private dental clinics across Mauritius. A sample size of 294 and 271 patients was included for public healthcare centers and private dental clinics. Data were collected during the months of November and December 2022.
A pre-designed, validated, and tested questionnaire using a Likert- type scale with five points ranging from strongly satisfied (5) to strongly dissatisfied (1) was used. This type of questionnaire has been widely used in previous research and has been shown to have good reliability and validity for measuring patient satisfaction in dental care settings [5].
The questionnaire structure was based on the Donabedian Model [6], which evaluates healthcare quality based on Structure, Process, and Outcome.
In this study, the questionnaire was divided into 3 parts as follows:
1. The clinical dental services, which consist of
-The dentist's performance included questions concerning dentists' availability, competence, punctuality, communication abilities depicted by listening skills, ability to provide clear explanations, and pre and post-treatment instructions.
- The dental assistants' performance with such questions as the availability of dental assistants and how quickly they respond to patient's needs and infection protocol.
2. The non-clinical services were divided into 3 parts:
- The facility of obtaining suitable appointment dates and the waiting time before meeting the doctor.
- The reception area evaluates the availability of seats in the waiting area and its interior décor.
- The reception staff: how well patients are welcomed at reception, the ease of obtaining suitable dates for appointments through the receptionists.
3. Patients' satisfaction with treatment results, promptness in dealing with emergencies, and sterilization and infection-control protocols.
Sociodemographic aspects like gender, age, and education level were also considered.
The principles of the Declaration of Helsinki and the International Conference on Harmonisation guidelines were used while conducting this study. The following Research protocol was followed:
1. During the study period, all patients who attended the clinics were briefed about the aim of the study and were allowed to ask any questions. Before filling out the questionnaire, patients were asked to sign the consent form.
2. Participation in the survey was voluntary. That is, only those willing to participate filled in the questionnaire.
3. Patients were informed that participating or not participating had no adverse consequence on the treatment they would receive on that day or any other day after that.
4. Every participant was assured of the confidentiality of the information given and that the information will be used for scientific purposes only
5. Inclusion: All patients willing to participate in the survey
6. Exclusion: Patients not willing to participate, patients with cognitive impairment, and those who could not communicate were excluded from the study.
7. The survey was anonymous since name, address, and identity number were not included in the questionnaire.
2.1 Data Analysis
This study used IBM SPSS Statistics 26 (Statistical Package for the Social Sciences) and Microsoft Excel 2019 for data analysis. Survey data was initially entered on an Excel spreadsheet before being cleansed and exported to SPSS. The latter was used to process data, generate tables of frequencies and percentages, and test hypotheses, whereas Excel mainly contributed to illustrating responses on charts. The inferential analysis included the correlation analysis of research constructs, multiple regression analysis to test the main research hypotheses, and cross-sectional study. Moreover, it should be mentioned that data was collected from public and private healthcare institutions and that a comparative analysis was conducted based on patients' perspectives.
3. Results
3.1 Data Testing
In addition to the statistically significant sample sizes (294 and 271 in public and private institutions, respectively), data were tested for reliability, construct validity, and sample adequacy to ensure that the results of this project are adequate for robust statistical inference, as described in the following sections.
Reliability
Wiener et al. [6] argued that "reliability is the extent to which the items measuring a construct exhibit internal consistency." Thus, the responses to the four sets of statements under Satisfaction with Dentists' Performance, Satisfaction with Dental Assistants, Satisfaction with Non-Clinical Dental Services, and Overall Satisfaction were e tested for reliability. According to Laerd Statistics [7], Cronbach's Alpha is the most appropriate measure of internal consistency whenever a measuring instrument contains several Likert-type statements. Table 1 below gives the results for reliability for both sets of patients.
Table 1: Results of reliability tests
|
|
Number of items |
Cronbach Alpha Coefficient |
|
|
Public |
Private |
||
|
Satisfaction with Dentists’ Performance |
5 |
0.883 |
0.852 |
|
Satisfaction with Dental Assistants |
5 |
0.882 |
0.900 |
|
Satisfaction with Non-Clinical Dental Services |
7 |
0.907 |
0.891 |
|
Overall Satisfaction |
3 |
0.816 |
0.844 |
According to past research, for acceptable internal consistency, reliability coefficients should have a lower bound of 0.6 [8] and an upper bound of 0.95 [9]. The survey questionnaire was deemed internally consistent because all four reliability coefficients were within these two limits.
Construct Validity and Sample Adequacy
The validity, according to Wiener et al., "refers to the extent to which a measure is judged to be reflective of, or theoretically linked to, some construct of interest." In this study, SPSS used factor validity [10] to measure the construct validity of the survey questionnaire. The significance of Bartlett's sphericity test was examined by conducting a principal components analysis of the responses to each of the four sets of Likert-type statements. Alongside, SPSS tested the adequacy of the sample via the Kaiser-Meyer-Olkin (KMO) statistic. The test results for construct validity and sample adequacy are shown in Table 2 below.
Table 2: Results of construct validity and sample adequacy tests
|
|
Bartlett test of Sphericity (Validity) |
KMO-statistics (Sample adequacy) |
||
|
Public |
Private |
Public |
Private |
|
|
Satisfaction with Dentists’ Performance |
< 0.001 |
< 0.001 |
0.870 |
0.846 |
|
Satisfaction with Dental Assistants |
< 0.001 |
< 0.001 |
0.847 |
0.832 |
|
Satisfaction with Non-Clinical Dental Services |
< 0.001 |
< 0.001 |
0.887 |
0.894 |
|
Overall Satisfaction |
< 0.001 |
< 0.001 |
0.687 |
0.715 |
3.2 Demographics
Table 3: Demographic profile of patients
|
Variables |
Categories |
Public (n = 294) |
Private (n = 271) |
||
|
Frequency |
Percentage |
Frequency |
Percentage |
||
|
Age group (years) |
Less than 18 |
40 |
14.2 |
28 |
10.4 |
|
|
18 – 40 |
137 |
48.8 |
129 |
48.2 |
|
|
41 – 60 |
88 |
31.3 |
77 |
28.7 |
|
|
More than 60 |
16 |
5.7 |
34 |
12.7 |
|
Gender |
Male |
112 |
40.7 |
98 |
36.8 |
|
|
Female |
163 |
59.3 |
168 |
63.2 |
|
Level of education |
Primary |
13 |
5.0 |
11 |
4.2 |
|
|
Secondary |
178 |
68.7 |
120 |
46.2 |
|
|
Tertiary |
68 |
26.3 |
129 |
49.6 |
* All three demographic variables had missing values
Salient Demographic Figures
In Table. 3, it is observed that the composition of age groups of patients was almost the same for both sets of patients for those aged 18-40 years (public: 48.8 %, private: 48.2 %) and 41-60 years (public: 31.3 %, private: 28.7 %). However, in public health institutions, there were slightly more patients aged less than 18 years (14.2 % as opposed to 10.4 %) but fewer of those aged more than 60 years (5.7 % as opposed to 12.7 %). Concerning gender, there were more female patients from public (59.3 %) and private (63.2 %) institutions.
Lastly, more than two-thirds (68.7 %) of patients from public health institutions studied up to the secondary level, whereas 26.3% attended universities. In the case of private institutions, 46.2 % and 49.6 % of patients studied up to secondary and tertiary levels, respectively.
3. 3 Comparative Analysis of Public vs. Private Health Institutions
In this section, the responses to the sets of statements under each of the four research constructs were analyzed descriptively using the weighted means method [12]. A mean and standard deviation were computed for each account by respectively assigning weights of 1 to 5 to the Likert options (“Strongly dissatisfied,” “Dissatisfied,” “Neutral,” “Satisfied,” and “Strongly satisfied”). This exercise was separately conducted for each set of patients before displaying a multiple bar chart and conducting the independent-samples t-test to determine whether there was any significant difference between the means related to each statement for each type of institution. The graphs show a comparison of means for each account.
Satisfaction with Dentists’ Performance
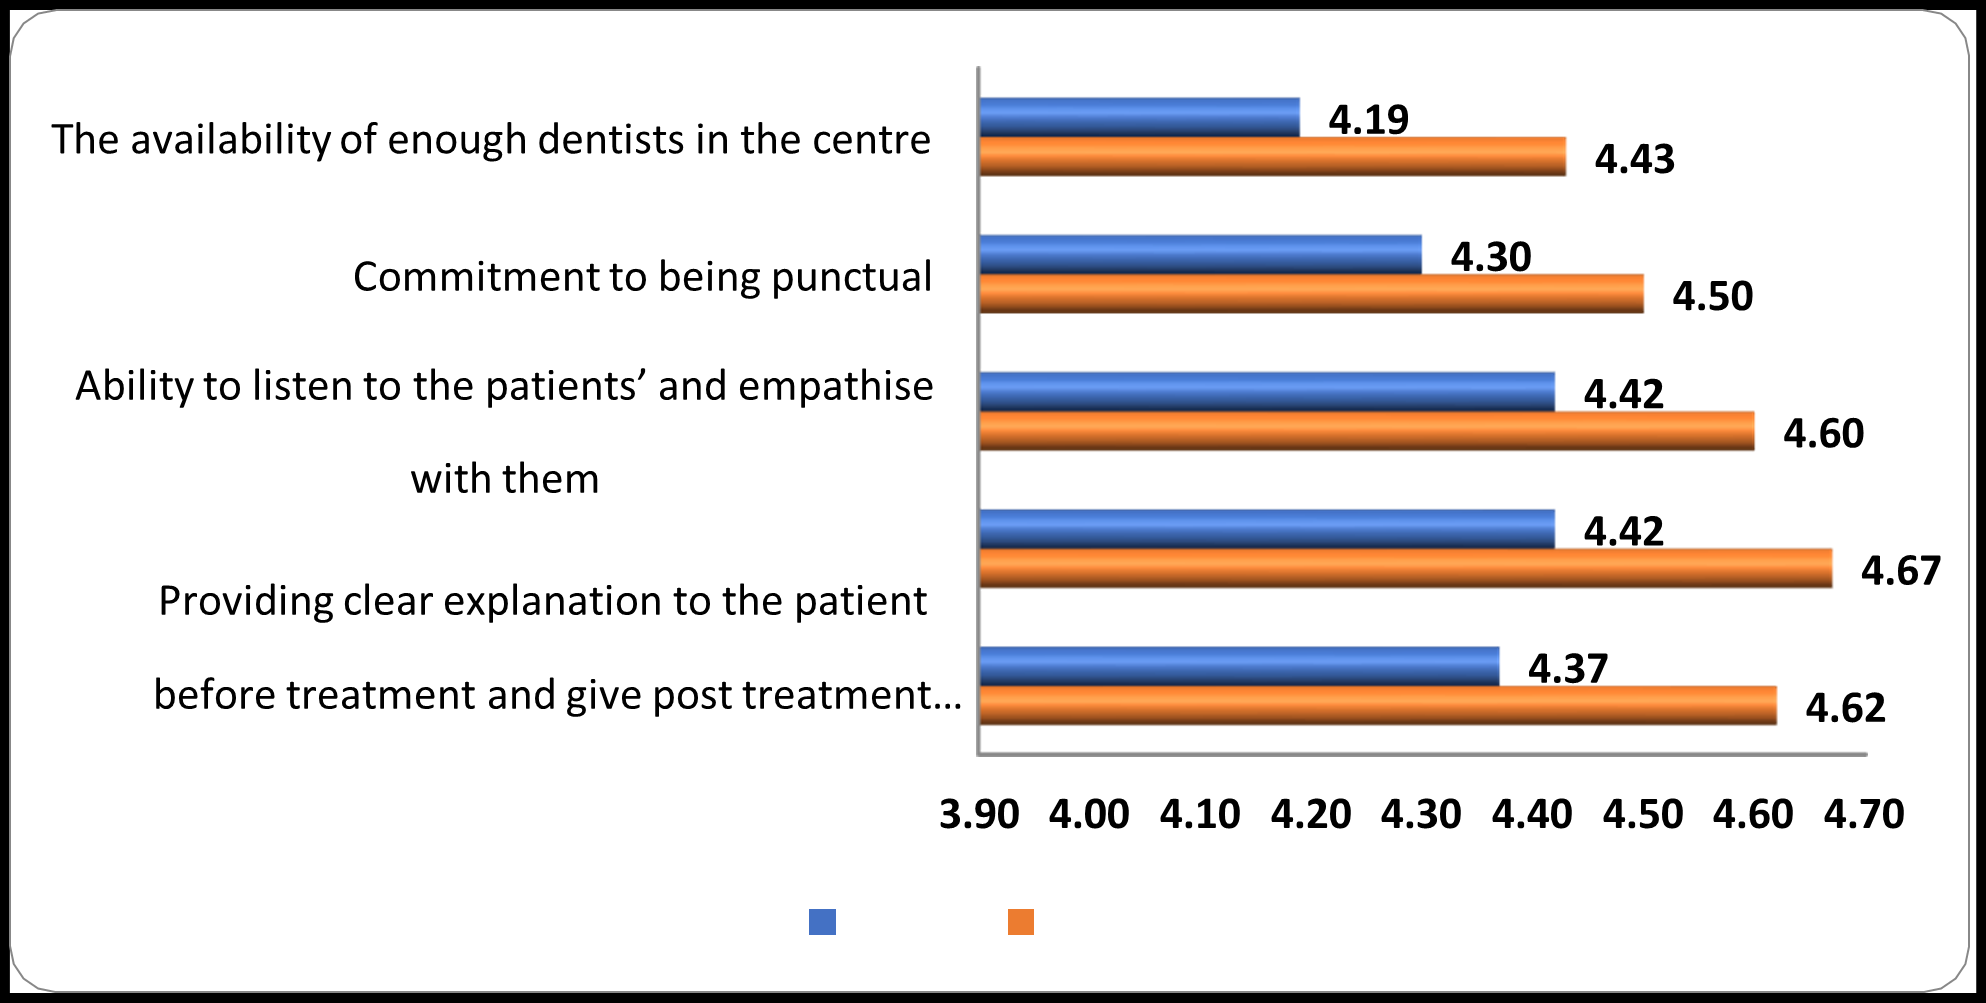
Figure 1: Satisfaction with dentists’ performance
The above multiple bar chart (Figure 1) shows that all the mean satisfaction scores for patients from private health institutions exceeded those rated by their counterparts from public institutions.
With the differences varying between 0.18 and 0.25, the most pronounced ones were those related to the availability of dentists (D = 0.24), provision of pre-treatment explanations and post-treatment instructions (D = 0.25), and clinical competence in performing procedures at the designated timeframe (D = 0.25). Nonetheless, the independent samples t-test was conducted for each statement to determine the statistical significance of these differences, considering the means for both sets of patients. The results are given in Table 4 below.
Table 4: Satisfaction with dentists’ performance
|
Statements |
Public |
Private |
|
|
||
|
Mean |
SD |
Mean |
SD |
t |
p |
|
|
The availability of enough dentists in the centre |
4.19 |
0.78 |
4.43 |
0.67 |
-3.96 |
0.000** |
|
Commitment to being punctual |
4.30 |
0.84 |
4.50 |
0.70 |
-3.07 |
0.002** |
|
Ability to listen to the patients’ and empathise with them |
4.42 |
0.69 |
4.60 |
0.62 |
-3.11 |
0.002** |
|
Providing clear explanation to the patient before treatment and give post treatment instructions |
4.42 |
0.75 |
4.67 |
0.57 |
-4.42 |
0.000** |
|
Clinical competence in performing the dental procedure at the designated time frame |
4.37 |
0.77 |
4.62 |
0.59 |
-4.23 |
0.000** |
** Significant at the 1 % level
It is observed from the p-values in the last column of the above table that all five differences were significant at the 1% level (p < 0.01), meaning that each aspect of satisfaction with dentists’ performance was significantly higher at private health institutions, as compared to those at public institutions.
Satisfaction with Dental Assistants
Figure 2 below shows the means obtained about patients’ satisfaction with dental assistants from both public and private institutions. Again, it is observed that the standards for each statement, as rated by patients from private health institutions, were more significant than those obtained from patients attending public institutions, with differences this time ranging from 0.21 to as high as 0.42.
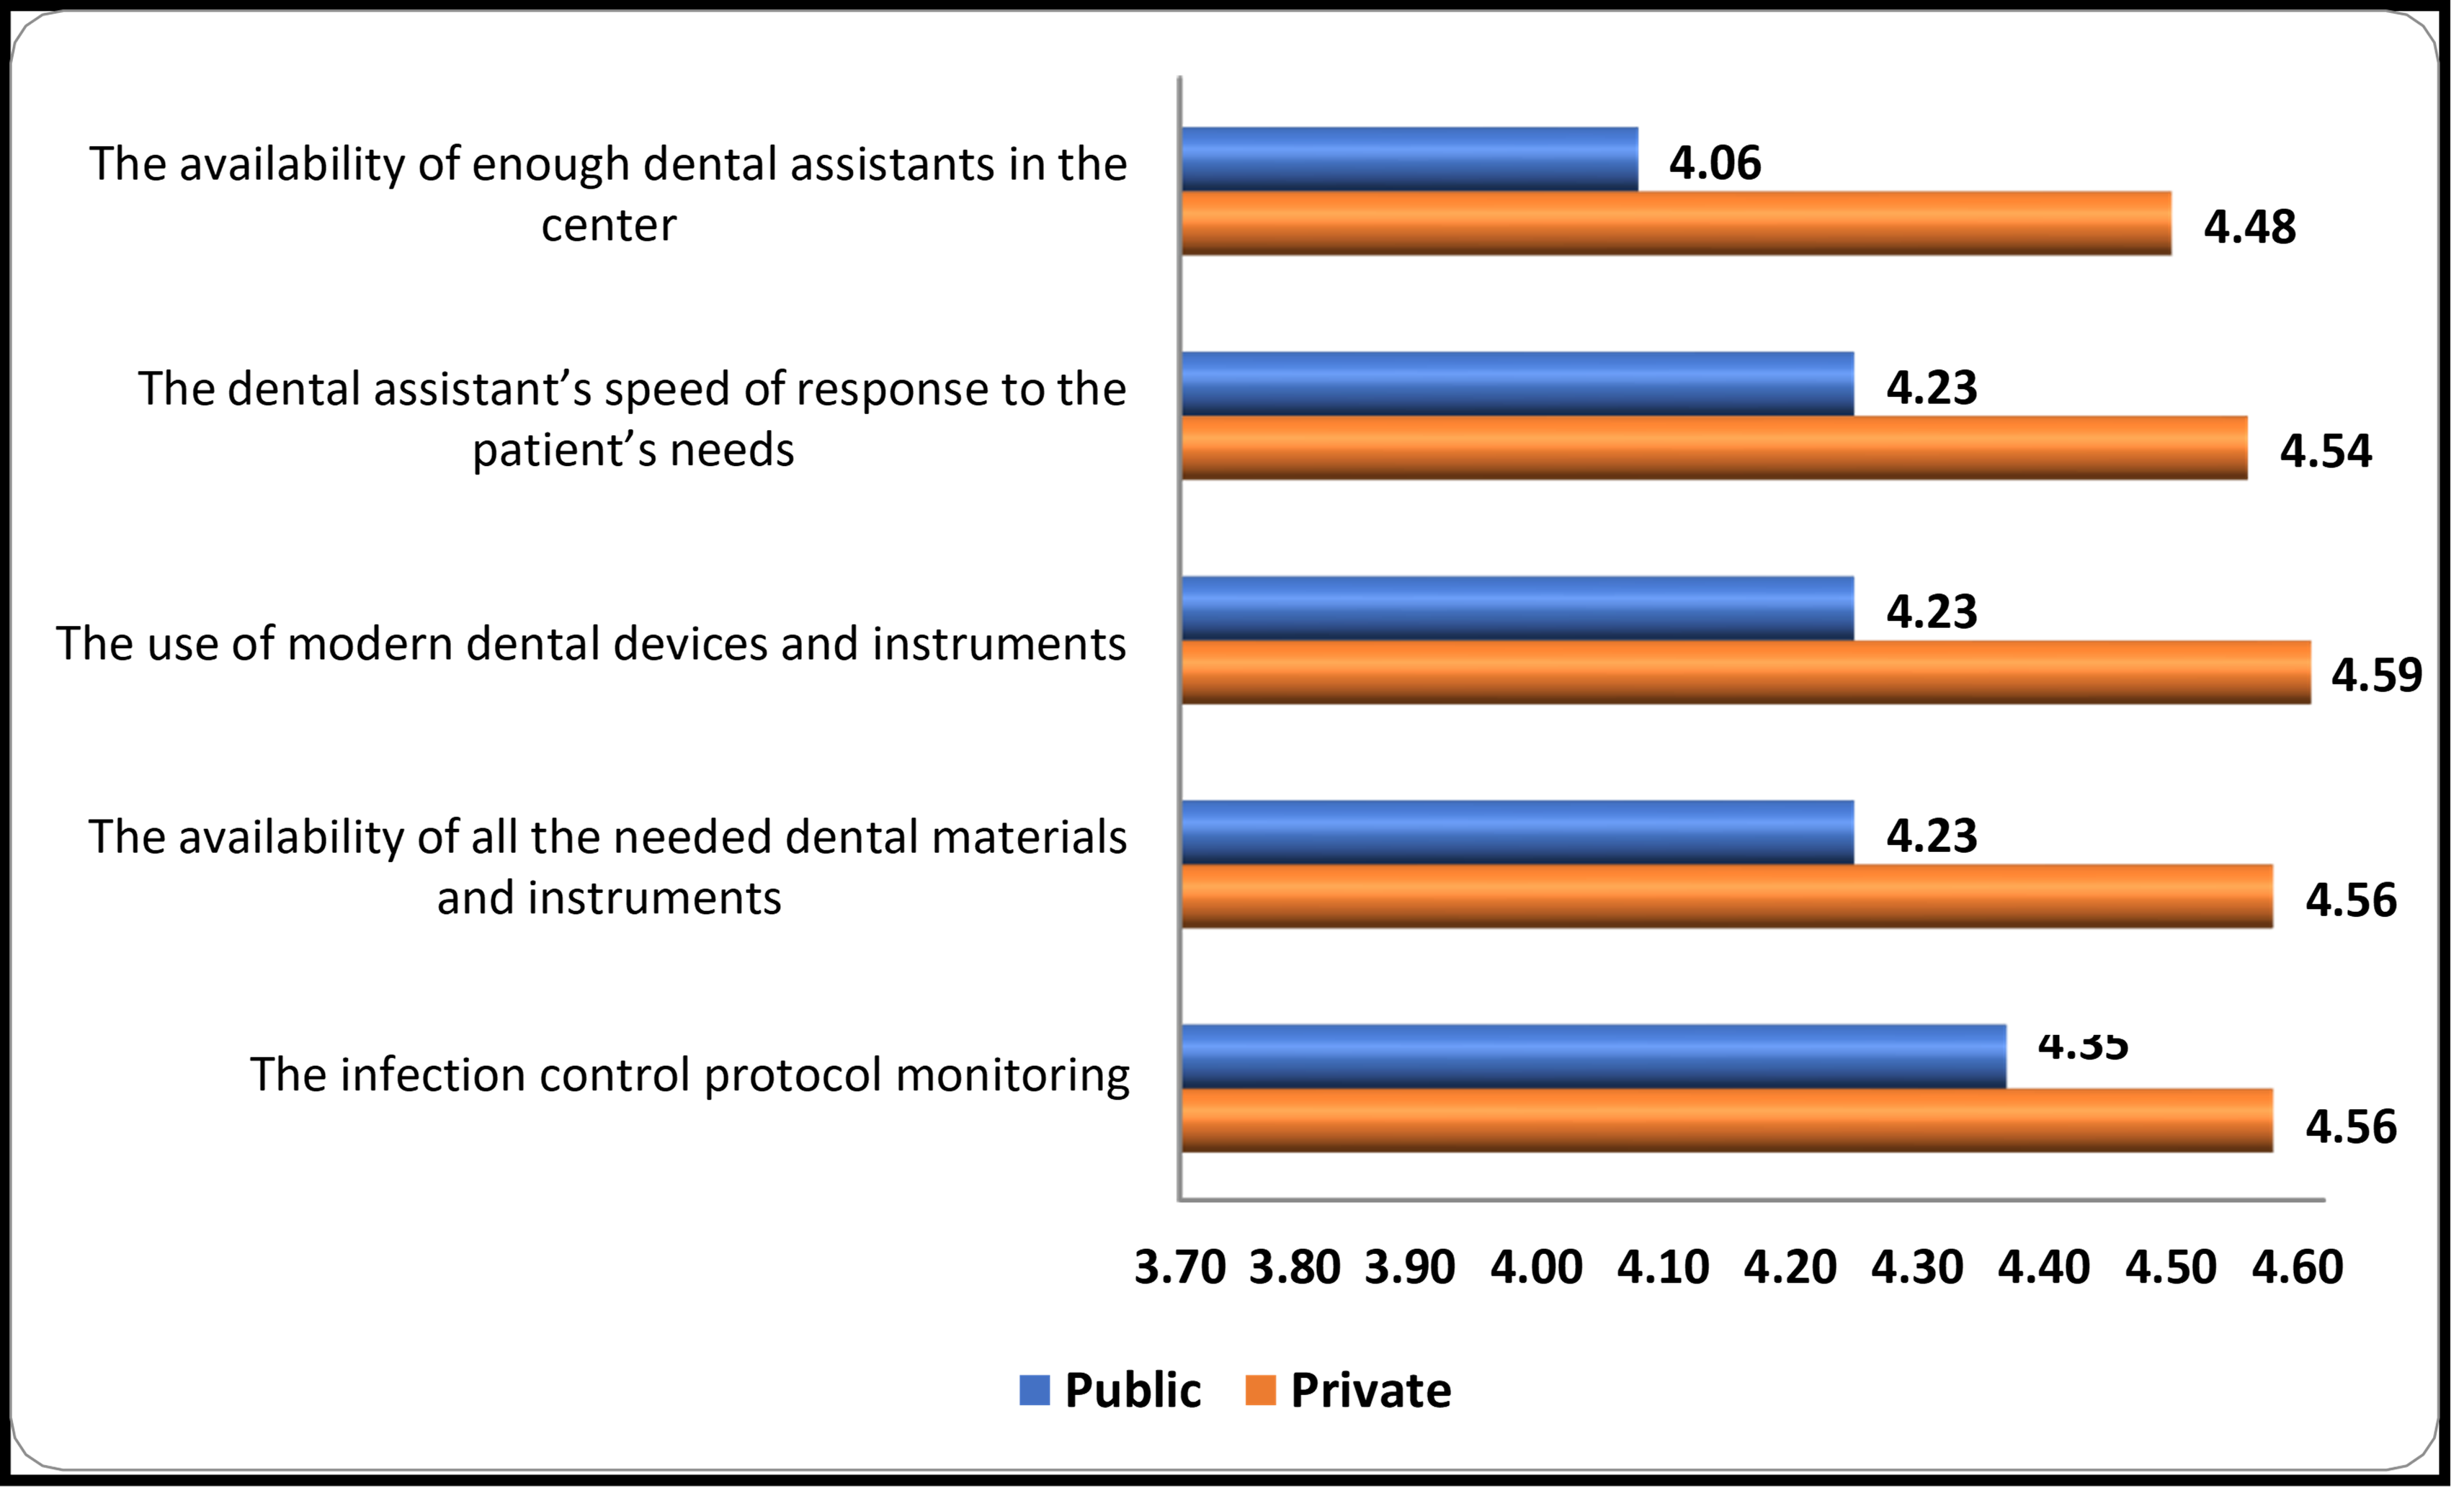
Figure 2: Satisfaction with dental assistants
The slightest difference was related to institutions’ compliance with the infection control protocol monitoring (D = 0.21), meaning that protocols were more or less equally respected in both types of health institutions. However, relatively significant differences were observed for speed of response (D = 0.31), availability (D = 0.33), and use (D = 0.36) of dental materials and instruments, culminating in a peak for the availability of sufficient numbers of dental assistants (D = 0.42).
Inferential statistics for differences between means are given in Table 5 below, as generated by SPSS for the independent samples t-test. Just like in the case of satisfaction with dentists’ performance (Table 4 above), the p-values for all five statements were significant at the 1% level (p < 0.01), meaning that, in private health institutions, patients were significantly more satisfied than their counterparts from public institutions with regards to dental assistants.
Table 5: Satisfaction with dental assistants
|
Statements |
Public |
Private |
|
|
||
|
Mean |
SD |
Mean |
SD |
t |
p |
|
|
The availability of enough dental assistants in the center |
4.06 |
0.94 |
4.48 |
0.66 |
-6.25 |
0.000** |
|
The dental assistant’s speed of response to the patient’s needs |
4.23 |
0.78 |
4.54 |
0.60 |
-5.24 |
0.000** |
|
The use of modern dental devices and instruments |
4.23 |
0.79 |
4.59 |
0.62 |
-5.93 |
0.000** |
|
The availability of all the needed dental materials and instruments |
4.23 |
0.77 |
4.56 |
0.64 |
-5.50 |
0.000** |
|
The infection control protocol monitoring |
4.35 |
0.71 |
4.56 |
0.66 |
-3.61 |
0.000** |
** Significant at the 1 % level
Satisfaction with Non-Clinical Dental Services
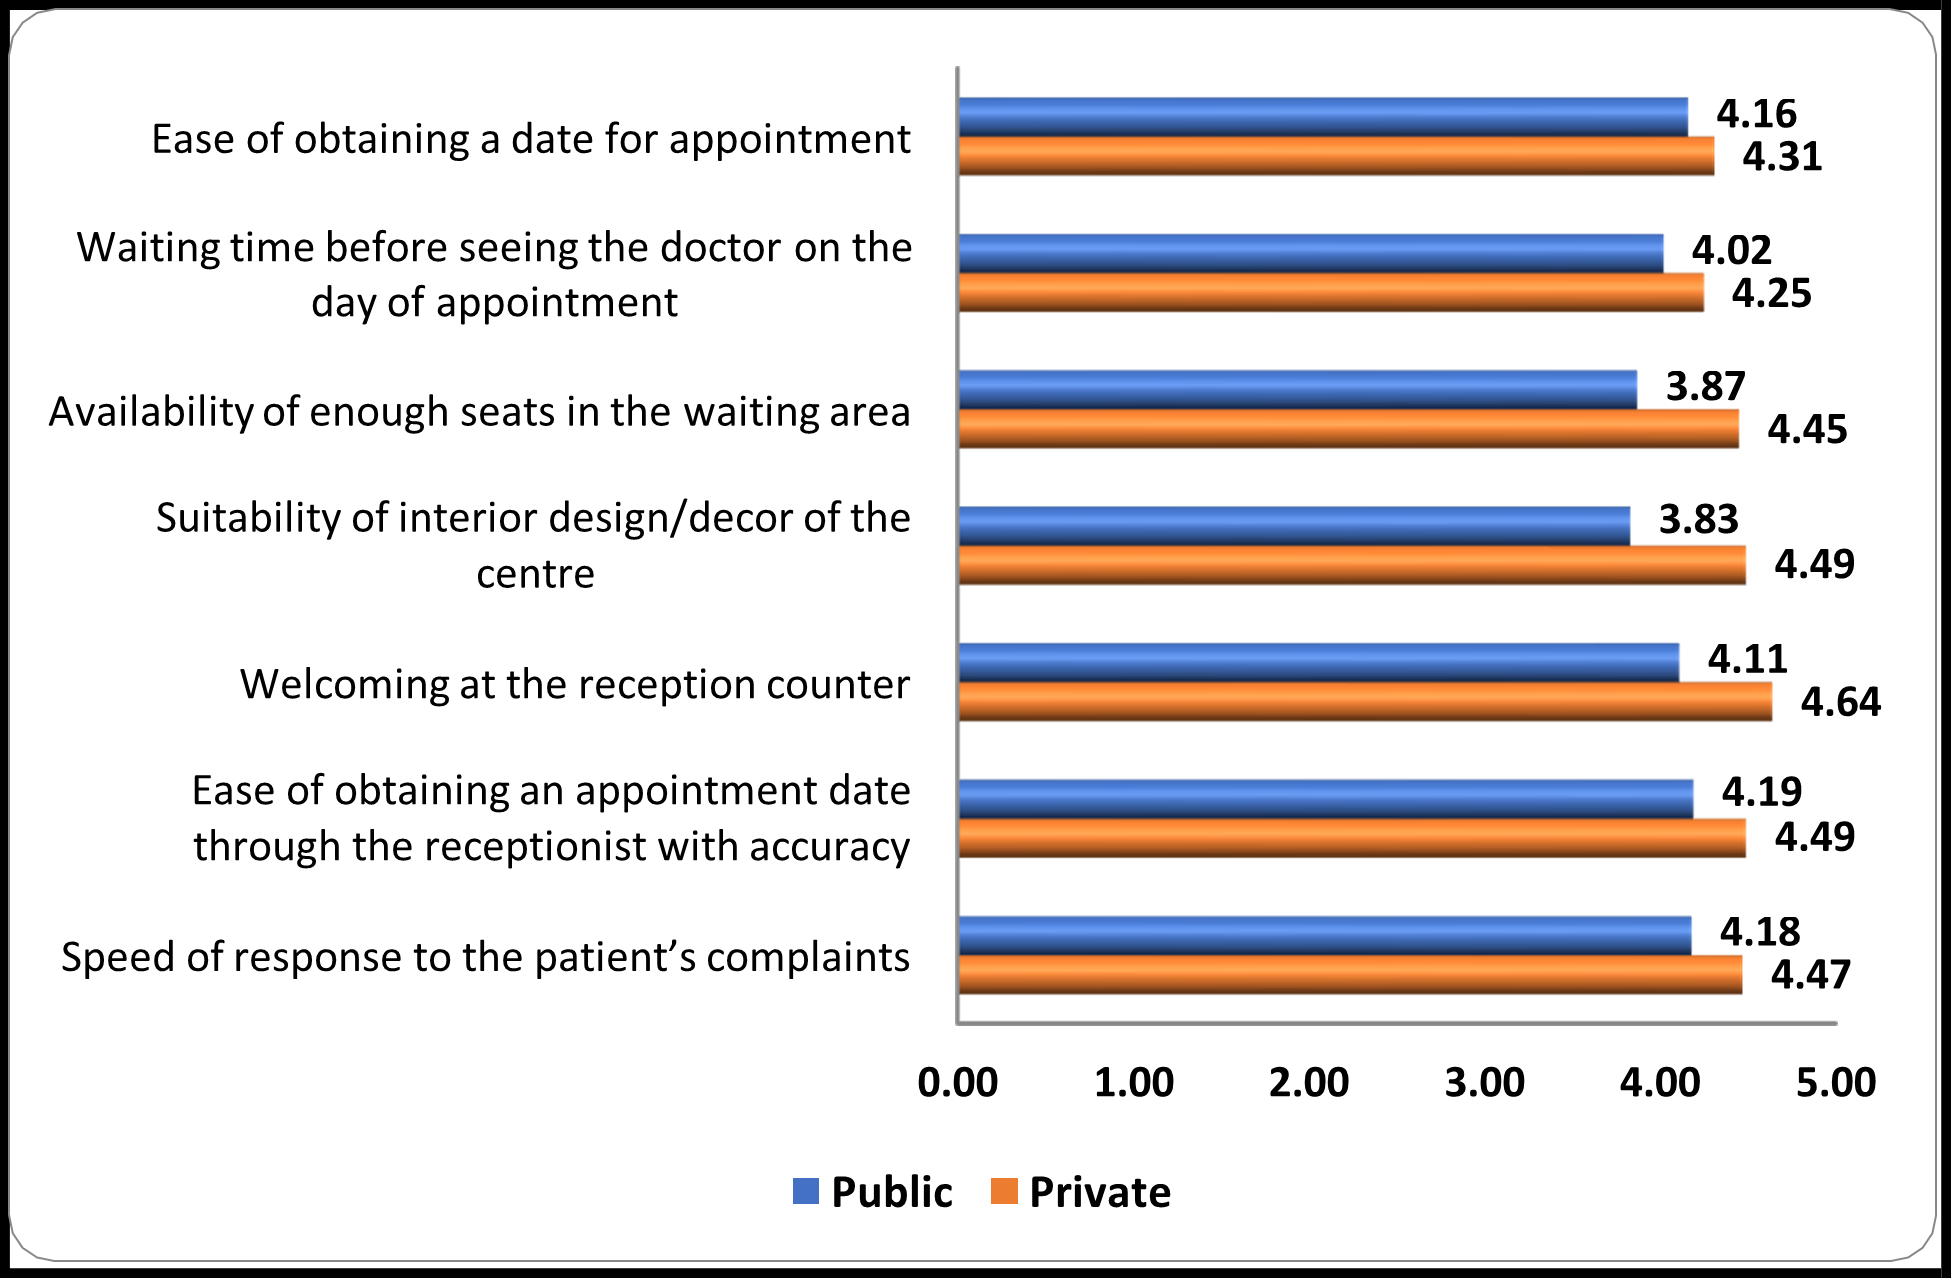
Figure 3: Satisfaction with non-clinical dental services
Figure 3 above shows that the red bars (private) are longer than the blue ones (public) for each of the seven statements related to patients' satisfaction with non-clinical dental services. Two differences stood out, namely the availability of enough seats in the waiting area (D = 0.58) and the suitability of the center's interior design (D = 0.66), which were both related to tangibles. Moreover, there was a considerable difference (D = 0.53) in how patients were welcomed at the reception counters of private health institutions. Moderate differences were observed for ease of obtaining appointments through receptionists (D = 0.30), speed of responses to patients' complaints (D = 0.29) and waiting time before seeing doctors on the day of the appointment (D = 0.23), all being in favor of private institutions. The slightest difference (D = 0.15) was related to the ease of obtaining an appointment date.
Table 6: Satisfaction with dental assistants
|
Statements |
Public |
Private |
|
|
||
|
Mean |
SD |
Mean |
SD |
t |
p |
|
|
Ease of obtaining a date for appointment |
4.16 |
0.91 |
4.31 |
0.82 |
-2.03 |
0.043* |
|
Waiting time before seeing the doctor on the day of appointment |
4.02 |
0.91 |
4.25 |
0.79 |
-3.17 |
0.002** |
|
Availability of enough seats in the waiting area |
3.87 |
1.01 |
4.45 |
0.65 |
-8.09 |
0.000** |
|
Suitability of interior design/decor of the centre |
3.83 |
1.03 |
4.49 |
0.67 |
-9.11 |
0.000** |
|
Welcoming at the reception counter |
4.11 |
0.87 |
4.64 |
0.55 |
-8.69 |
0.000** |
|
Ease of obtaining an appointment date through the receptionist with accuracy |
4.19 |
0.79 |
4.49 |
0.70 |
-4.62 |
0.000** |
|
Speed of response to the patient’s complaints |
4.18 |
0.82 |
4.47 |
0.68 |
-4.61 |
0.000** |
* Significant at the 5 % level; ** Significant at the 1 % level
The independent samples t-test showed that all the differences were significant at the 1 % level (p < 0.01), except for the ease of obtaining an appointment date, which was necessary at the 5 % level (p = 0.043).
Nonetheless, results showed that patients’ satisfaction with non-clinical dental services was significantly higher for private health institutions than public ones.
Overall Satisfaction
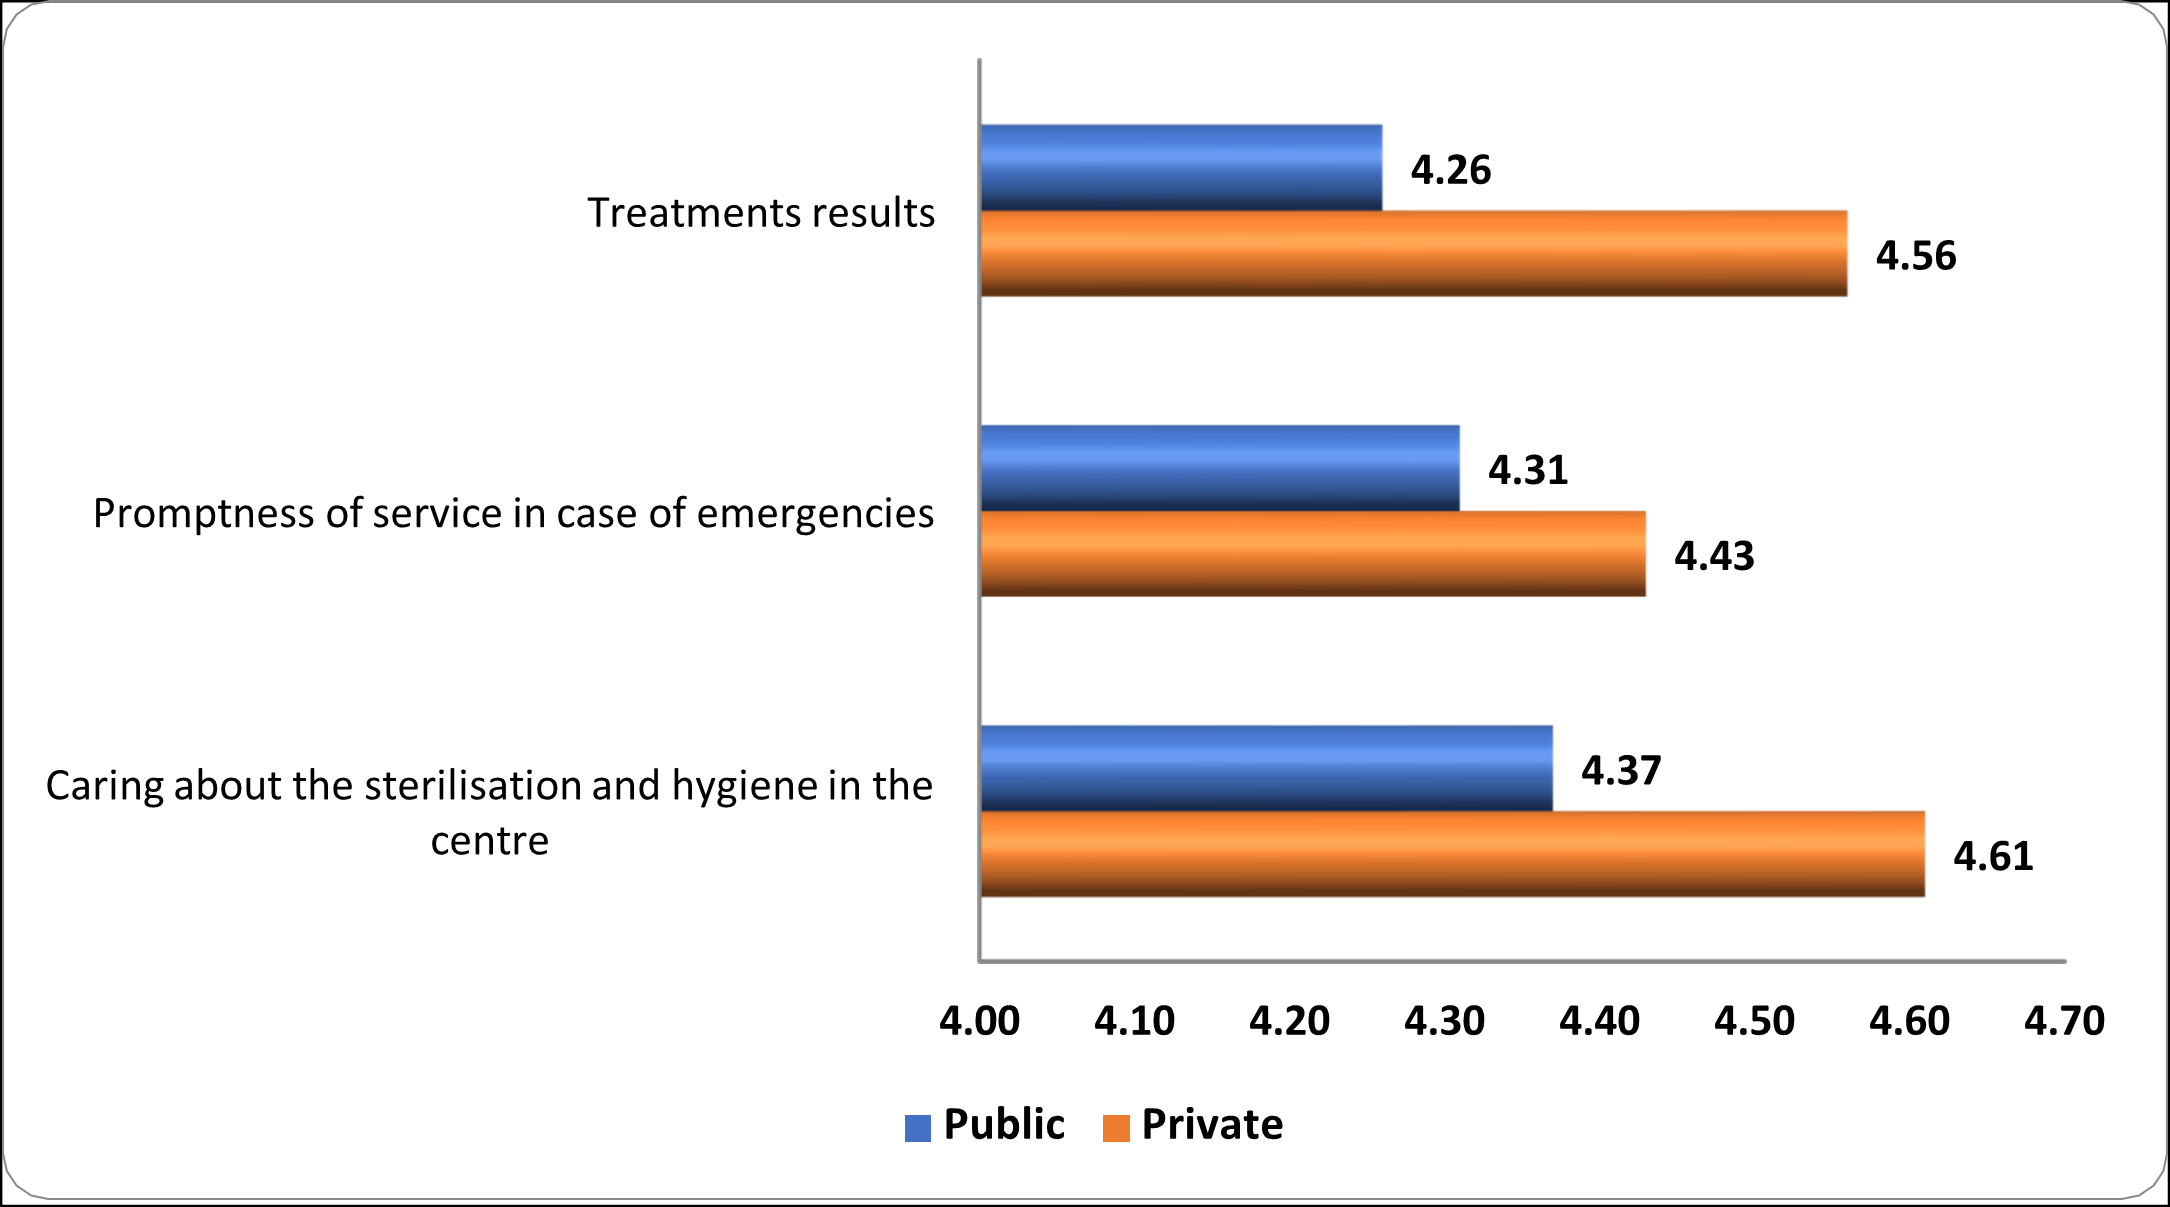
Figure 4: Overall satisfaction
As for patients’ overall level of satisfaction, means for private institutions expectedly exceed those for public institutions, as shown in Figure 4. Treatment results (D = 0.30) and caring about sterilization and hygiene (D = 0.24) recorded relatively higher differences than that for the promptness of emergency services (D = 0.12).
Table 7: Overall satisfaction
|
Statements |
Public |
Private |
|
|
||
|
Mean |
SD |
Mean |
SD |
t |
p |
|
|
Treatments results |
4.26 |
0.73 |
4.56 |
0.58 |
-5.31 |
0.000** |
|
Promptness of service in case of emergencies |
4.31 |
0.77 |
4.43 |
0.70 |
-1.90 |
0.058 |
|
Caring about the sterilization and hygiene in the centre |
4.37 |
0.67 |
4.64 |
0.54 |
-4.66 |
0.000** |
** Significant at the 1 % level
In line with the above observations, two significant differences were identified that were in favor of private health institutions at the 1 % level (p < 0.01), whereas the difference in promptness of emergency services between the two types of institutions was not significant at the 5 % level (p = 0.058).
3.4 Inferential Analysis
Correlation Analysis
Correlation analysis was conducted separately as a pre-requisite for testing a multiple regression model for patients from each type of institution, i.e., public and private. With the dependent variable being Overall Satisfaction, the proposed predictors were Satisfaction with Dentists’ Performance, Satisfaction with Dental Assistants, and Satisfaction with Non-Clinical Dental Services. It is to be noted that all four constructs were computed as the overall mean of the mean scores of their statements, so Pearson’s coefficient was used to measure the correlations. Table 8 gives the correlation coefficients obtained by SPSS.
Table 8: Correlation matrix of constructs (public)
|
Constructs |
(1) |
(2) |
(3) |
(4) |
|
(1) Satisfaction with Dentists’ Performance |
1 |
|
|
|
|
(2) Satisfaction with Dental Assistants |
.769** |
1 |
|
|
|
(3) Satisfaction with Non-Clinical Dental Services |
.655** |
.722** |
1 |
|
|
(4) Overall Satisfaction |
.718** |
.648** |
.658** |
1 |
** p < 0.01
It is observed that the correlations among the independent constructs were not only significantly and positively correlated with one another but also with Overall Satisfaction at the 1 % level. Thus, there was no doubt that these results justified testing a multiple regression model, especially given that correlation need not imply causality [14].
This exercise was repeated for responses obtained from patients attending private health institutions, with the same aim of testing a multiple regression model. The results, which are given in Table 9 below, show a pattern identical to that obtained for patients attending public health institutions, but with the correlation coefficients slightly higher among all the constructs. Once again, the results lay a strong foundation for testing a multiple regression model, as will be shown in the next section.
Table 9: Correlation matrix of constructs (private)
|
Constructs |
(1) |
(2) |
(3) |
(4) |
|
(1) Satisfaction with Dentists’ Performance |
1 |
|
|
|
|
(2) Satisfaction with Dental Assistants |
.761** |
1 |
|
|
|
(3) Satisfaction with Non-Clinical Dental Services |
.703** |
.752** |
1 |
|
|
(4) Overall Satisfaction |
.741** |
.776** |
.697** |
1 |
** p < 0.01
Multiple Regression Analysis
In this study, multiple regression analysis was carried out to determine the significance of the impacts of Satisfaction with Dentists’ Performance, Satisfaction with Dental Assistants, and Satisfaction with Non-Clinical Dental Services on the dependent variable Overall Satisfaction for patients attending public and private health institutions separately. In each case, three hypotheses were to be tested, as formulated below:
Hypothesis 1
H0: Satisfaction with Dentists’ Performance has no impact on Overall Satisfaction
H1: Satisfaction with Dentists’ Performance has a significant positive impact on Overall Satisfaction
Hypothesis 2
H0: Satisfaction with Dental Assistants has no impact on Overall Satisfaction
H1: Satisfaction with Dental Assistants has a significant positive impact on Overall Satisfaction
Hypothesis 3
H0: Satisfaction with Non-Clinical Dental Services has no impact on Overall Satisfaction
H1: Satisfaction with Non-Clinical Dental Services has a significant positive impact on Overall Satisfaction
Reporting of Results (Public)
Table 10: Model Summary
|
Model |
R |
R Square |
Adjusted R Square |
Std. Error of the Estimate |
Change Statistics |
||
|
R Square Change |
F Change |
Sig. F Change |
|||||
|
1 |
.760a |
.578 |
.574 |
.40493 |
.578 |
130.592 |
.000 |
|
a. (Constant), Satisfaction with Dentists’ Performance, Satisfaction with Dental Assistants, Satisfaction with Non-Clinical Dental Services |
|||||||
|
b. Dependent variable: Overall Satisfaction |
|||||||
First of all, the p-value (Sig. F Change) in Table 10 confirms that the regression model was significant at the 1 % level (p < 0.01), meaning that at least one of the predictors significantly impacted Overall Satisfaction. The coefficient of determination (R2) showed that the three predictors explained 57.8 % of the variability in Overall Satisfaction, so the model fitted the sample data quite well.
Table 11: Regression coefficients
|
Model |
Unstandardized Coefficients |
Standardized Coefficients |
|
||
|
B |
Std. Error |
Beta |
t |
Sig. |
|
|
(Constant) |
1.024 |
.170 |
|
6.014 |
.000 |
|
Satisfaction with Dentists’ Performance |
.452 |
.060 |
.464 |
7.482 |
.000 |
|
Satisfaction with Dental Assistants |
.069 |
.063 |
.074 |
1.100 |
.272 |
|
Satisfaction with Non-Clinical Dental Services |
.256 |
.049 |
.299 |
5.242 |
.000 |
|
a. Dependent Variable: Overall Satisfaction |
|||||
SPSS-generated table of coefficients (Table 11) shows that Satisfaction with Dentists’ Performance (β = .464, t = 7.482, p < .001) and Satisfaction with Non-Clinical Dental Services (β = .299, t = 5.242, p < .001) impacted significantly and positively on Overall Satisfaction at the 1% level. With a β-coefficient of higher magnitude (.464), Satisfaction with Dentists’ Performance had the more significant impact on Overall Satisfaction for patients attending public health institutions. Therefore, null hypotheses 1 and 3 above were rejected at the 1 % level.
On the other hand, none of the Satisfaction with Dental Assistants (β = .074, t = 1.100, p = .272) significantly impacted Overall Satisfaction at the 5 % level. Thus, there was insufficient statistical evidence to reject null hypothesis 2 at the 5% level.
Reporting of Results (Private)
Table 12: Model Summary
|
Model |
R |
R Square |
Adjusted R Square |
Std. Error of the Estimate |
Change Statistics |
||
|
R Square Change |
F Change |
Sig. F Change |
|||||
|
1 |
.818a |
.668 |
.664 |
.30870 |
.668 |
171.306 |
.000 |
|
a. (Constant), Satisfaction with Dentists’ Performance, Satisfaction with Dental Assistants, Satisfaction with Non-Clinical Dental Services |
|||||||
|
b. Dependent variable: Overall Satisfaction |
|||||||
In the case of patients attending private health institutions, the multiple regression model was also significant at the 1 % level (p < 0.01), as shown in Table 12. Moreover, the predictors explained 66.8 % of the shared variance with Overall Satisfaction, meaning that the model was an excellent fit for the data.
Table 13: Regression coefficients
|
Model |
Unstandardized Coefficients |
Standardized Coefficients |
|
||
|
B |
Std. Error |
Beta |
t |
Sig. |
|
|
(Constant) |
.465 |
.182 |
|
2.550 |
.011 |
|
Satisfaction with Dentists’ Performance |
.323 |
.061 |
.307 |
5.292 |
.000 |
|
Satisfaction with Dental Assistants |
.412 |
.062 |
.415 |
6.611 |
.000 |
|
Satisfaction with Non-Clinical Dental Services |
.165 |
.055 |
.171 |
2.988 |
.003 |
|
a. Dependent Variable: Overall Satisfaction |
|||||
The p-values in the table of regression coefficients (Table 13) show that all three predictors had significant positive impacts on Overall Satisfaction at the 1 % level: Satisfaction with Dentists’ Performance (β = .307, t = 5.292, p < .001), Satisfaction with Dental Assistants (β = .415, t = 6.611, p < .001) and Satisfaction with Non-Clinical Dental Services (β = .171, t = 2.988, p = .003). Satisfaction with Dental Assistants had the highest impact on Overall Satisfaction for patients attending private health institutions, with a β-coefficient of magnitude .415. Therefore, all three null hypotheses were rejected at the 1 % level.
Cross-Sectional Analysis
A cross-sectional analysis was conducted to test whether patients’ overall satisfaction was associated with their demographic characteristics. This technique was used for both sets of patients separately. First, the test variable Overall Satisfaction was tested for normality via the Shapiro-Wilk test in SPSS, given that both sample sizes were less than 2000 [15]. Normality testing was essential in determining the nature of tests, i.e., parametric or non-parametric. The results are given in the table below.
Table 14: Test of Normality (Shapiro-Wilk)
|
|
Public |
Private |
||||
|
|
Statistic |
df |
Sig. |
Statistic |
df |
Sig. |
|
Overall Satisfaction |
.880 |
290 |
.000 |
.796 |
260 |
.000 |
|
a. Lilliefors Significance Correction |
||||||
The above results show that overall satisfaction was not normally distributed in both cases since both p-values were significant at the 1% level. Therefore, the Mann-Whitney U test was used for gender (dichotomous variable), whereas the Kruskal-Wallis H test was used for age group and education level (multichotomous variables).
Table 15 below gives a summary of the SPSS output tables. It is to be noted that significant associations (if any) would be further examined using descriptive statistics for gender and type of institution (public only), as well as non-parametric post hoc tests via pairwise comparisons for age group and education level in SPSS to identify significant difference(s) between overall satisfaction among the subscales of relevant demographic variables.
Table 15: Association between patients’ demographic characteristics and their overall satisfaction
|
Mann-Whitney U or Kruskal-Wallis H tests |
||||
|
|
Public |
Private |
||
|
|
test-statistic |
p-value |
test-statistic |
p-value |
|
Type of institution |
2.171 |
0.030* |
- |
- |
|
Age group |
3.700 |
0.296 |
9.134 |
0.028* |
|
Gender |
-0.712 |
0.477 |
2.684 |
0.007** |
|
Education level |
1.364 |
0.506 |
12.162 |
0.002** |
* p < 0.05; ** p < 0.01
The above p-values show that overall satisfaction was significantly associated with only the type of institution (t = 2.171, p = 0.030) at the 5% level for patients attending public health institutions. In contrast, all of them (type of institution not relevant) had significant bearings on Overall Satisfaction in the case of patients attending private health institutions at both the 5% and 1% levels. Thus, age group (c2 = 9.134, p = 0.028) was significant at the 5% level, while gender (t = 2.684, p = 0.007) and education level (c2 = 12.162, p = 0.002) were significant at the 1% level.
Type of institution (public only)
Since the type of institution is a dichotomous variable (General, Specialised), a non-parametric post hoc test was not applicable, so descriptive statistics were used to determine the more satisfied subgroup.
Table 16: Descriptive Statistics
|
Type of institution |
N |
Mean |
Std. Deviation |
|
General |
174 |
4.2663 |
.58889 |
|
Specialized |
116 |
4.3908 |
.65978 |
Since a p-value of 0.030 was obtained for the association between type of institution and Overall Satisfaction (Table 15), Table 16 implies that patients attending specialized public institutions were significantly more satisfied than their counterparts attending general public institutions at the 5 % level.
Age group (private)
Table 16 shows the results of non-parametric post hoc test for age group, as output by SPSS.
Table 16: Pairwise comparisons of Age group
|
Sample 1-Sample 2 |
Test Statistic |
Std. Error |
Std. Test Statistic |
Sig. |
Adj. Sig.a |
|
More than 60 - 41-60 |
23.083 |
14.764 |
1.563 |
.118 |
.708 |
|
More than 60 - 18-40 |
36.575 |
13.808 |
2.649 |
.008 |
.048 |
|
More than 60 - Less than 18 |
45.600 |
18.020 |
2.531 |
.011 |
.068 |
|
41-60 - 18-40 |
13.492 |
10.273 |
1.313 |
.189 |
1.000 |
|
41-60 - Less than 18 |
22.518 |
15.480 |
1.455 |
.146 |
.875 |
|
18-40 - Less than 18 |
9.025 |
14.570 |
.619 |
.536 |
1.000 |
|
Each row tests the null hypothesis that the Sample 1 and Sample 2 distributions are the same. Asymptotic significances (2-sided tests) are displayed. The significance level is .05. |
|||||
|
a. Significance values have been adjusted by the Bonferroni correction for multiple tests. |
|||||
From the p-values in the last column of Table 16 above, only one significant difference was identified, namely that patients aged more than 60 years were significantly more satisfied than those aged 18-40 years (t = 2.649, p = 0.048) at the 5 % level.
Gender (private)
The result for gender (Male, Female) was also deduced from descriptive statistics to determine the subscale that was more satisfied.
Table 17: Descriptive Statistics
|
Gender |
N |
Mean |
Std. Deviation |
|
Male |
94 |
4.4238 |
.56621 |
|
Female |
161 |
4.6004 |
.50252 |
The p-value of 0.007 obtained for the association between gender and Overall Satisfaction (Table 15) mean that female patients were significantly more satisfied, as compared to their male counterparts at the 1% level.
Education level (private)
As far as education level is concerned, there was one significant difference among its subscales, as shown in Table 18 below. Figures show that patients who attended primary school were significantly less satisfied than those who attended secondary school (t = -3.017, p = 0.008) at the 1 % level.
Table 18: Pairwise comparisons of Education level
|
Sample 1-Sample 2 |
Test Statistic |
Std. Error |
Std. Test Statistic |
Sig. |
Adj. Sig.a |
|
Primary - Tertiary |
-46.854 |
22.218 |
-2.109 |
.035 |
.105 |
|
Primary - Secondary |
-67.370 |
22.327 |
-3.017 |
.003 |
.008 |
|
Tertiary - Secondary |
20.516 |
8.769 |
2.340 |
.019 |
.058 |
|
Each row tests the null hypothesis that the Sample 1 and Sample 2 distributions are the same. Asymptotic significances (2-sided tests) are displayed. The significance level is .05. |
|||||
|
a. Significance values have been adjusted by the Bonferroni correction for multiple tests. |
|||||
Discussion
As a welfare state, Mauritius provides free medical and dental treatment to its population and residing citizens. The debate over public versus private provision often involves consideration of resource allocation about both efficiency and equity ". Proponents of a more market-oriented system promote the patient's role as a healthcare consumer.[16]
As per the Mauritius National Action Plan for Oral Health 2022-2027, the total number of patients who attended Public Dental Clinics (static and mobile) in 2020 was 245,069. These patients were seen at the 54 dental clinics present across the island. The dental clinics are on the same premises as the medical health centers, sometimes sharing standard waiting rooms. To provide treatment for the maximum number of patients, public dental clinics operate on a first-come, first- served basis, with no limit to the number of patients seen daily. Usually, one dental assistant and one dental surgeon are posted per clinic. Triage is done, and emergency and pain alleviation treatment is given. Routine dental procedures are carried out on the same day, while lengthier treatment and appointments are offered. Those requiring specialized dental treatment are referred to the required departments accordingly.
On the other hand, private dental clinics around the island are more abundant. These private dental practices mainly receive patients on an appointment basis, with allocated time slots for each patient. The staff usually comprises one dentist, one or two dental assistants, and a receptionist. The layout of the patient waiting rooms is also different.
This shows a heavier workload for dental practitioners and dental assistants in public dental centers. A heavier workload implies less time allocated by dentists and dental assistants per patient, longer response time from dental assistants, longer waiting time for patients, and more difficulty obtaining an appointment. The way these 2 types of dental clinics operate could be one of the plausible explanations regarding these differences in patient satisfaction between the public and private dental clinics.
While in the private dental centers, patients were overall satisfied with all four aspects of the survey, it was noted that the performance of dental assistants did not influence the overall patient satisfaction in Public dental healthcare centers. Hence, it is worth investigating this service gap with the view of improving dental care treatment being provided in public health centers.
Despite this, the study shows a high score for Dentists' performance from both types of dental practices. This can be attributed to rigorous efforts taken by the Ministry of Health & Wellness and the Dental Council of Mauritius. To be registered as a Dentist in Mauritius, practitioners must undergo written and oral tests conducted by the Dental Council. Also, continuous education programs have been imposed for the yearly renewal of Dentists' practicing licenses. This forces practitioners to update their knowledge and skills by regularly attending conferences and workshops, which are vital to meet continuing education requirements.
From a demographic point of view, the dominant age groups in both public and private centers were 18-40, followed by 41-60 were noted. In public health institutions, more patients aged less than 18 years attended, but less of those aged more than 60 years. This can be explained by the Dental Department of the Ministry of Health and Wellness emphasizing prevention, hence Oral Health Education. Regular school visits are carried out by Dental Staff, whereby oral health talks are delivered, and students are requested to attend the nearest public dental clinics for check-ups and treatment.
Regarding gender, there were more female patients from both public and private institutions. This is in line with the submission of Eyasu et al. in an attempt to assess adult patients' satisfaction with inpatient nursing care and associated factors in an Ethiopian referral hospital in Northeast Ethiopia [17]. That study indicated that females were significantly more satisfied with care than their male counterparts. This is further corroborated by Alhusban and Abualrub [18] and Zarzycka et al. [19] in their separate submission. However, Ibraheem et al. posited that there is no gender influence on patient satisfaction. [20,21]
Lastly, more than two-thirds of patients from public health institutions studied up to the secondary level, whereas 26.3 % of them attended universities. In the case of private institutions, 46.2 % and 49.6 % of patients studied up to secondary and tertiary levels, respectively. Patients who are more highly educated might have more knowledge and expectations regarding the dental services being provided and the quality of dental care. Also, higher-income earners often have private health insurance and prefer to be seen by private dentists at their convenience. However, some studies show different observations regarding the
Recommendations
This survey can help policymakers to bridge the gap between the Public Dental Centres and the Private Dental Centres in Mauritius, with the view to improve the quality of care being provided. It has been observed that The Dental Staff (Dentists and Dental assistants) are of paramount importance when it comes to patients' satisfaction. Non-Clinical Dental Services also influence patient satisfaction.
Taking this into consideration, it can be recommended:
- More Dentists and Dental Assistants are recruited and posted at the various Public Dental Clinics throughout the island.
- More Public Dental Clinics are to be opened throughout the island to decrease the workload per clinic.
- Patients could be taken on an appointment basis as it is being done in Private Dental Clinics, however maintaining slots for emergencies.
- Continuous customer care training is to be provided to all dental staff.
- Changes are to be made regarding waiting rooms to provide patients with adequate seating arrangements and a more relaxed and pleasant atmosphere.
Limitations
- With the fear of not being adequately taken care of at their next visit, some patients might be unwilling to give negative opinions. This could account for high satisfaction results.
- The study was limited to patients willing to participate and who met the inclusion criteria, which may have resulted in a bias toward more satisfied patients.
- Being carried out as an exit interview, some patients might have been in a hurry to leave, and hence with high satisfaction results, without considering the implications.
- Other factors, such as the qualifications and experience of dental staff, the availability of advanced dental equipment, and the availability of different dental services, may also impact patient satisfaction. Such factors have yet to be taken into consideration in this study.
- Additionally, the study only focused on patient satisfaction and did not consider other important factors, such as accessibility and affordability of dental care. For example, private dental clinics may have shorter wait times and more efficient service; they may also be more expensive than public dental healthcare centers, making them less accessible to specific population segments. Therefore, it is essential to consider the accessibility and affordability of dental care and patient satisfaction when evaluating the quality of care provided by public and private dental clinics.
Conclusion
The results of the study provided important insights into the level of patient satisfaction with the dental care provided by public dental healthcare centers and private dental clinics in Mauritius. The study found that patient satisfaction was generally higher in Private Dental healthcare centers than in Public Dental Clinics. This may be because private dental clinics often have more resources and staff than public dental healthcare centers, which can lead to shorter wait times and more efficient service.
The study's results can inform healthcare policy and practice in Mauritius by identifying areas of improvement and potential strategies to enhance the quality of dental care provided in public and private healthcare centers. Future research should focus on assessing other factors that may affect patient satisfaction and the effectiveness of treatment, as well as the accessibility and affordability of dental care.
A need for intervention in Public Dental centers exists. These interventions would improve the quality of treatment and be more patient-focused service delivery to boost the image of the public dental centers. This would encourage an increase in the use of Public Dental Clinics and help improve participants' oral health, thereby promoting their well-being and quality of life.
Funding: This study was not funded by any organisation.
References
- Xesfingi S, Vozikis A (2016) Patient satisfaction with the healthcare system: Assessing the impact of socio-economic and healthcare provision factors. BMC Health Serv Res. 16: 94.
- Osiya DA, Ogaji DS, Onotai L (2017) Patients’ satisfaction with healthcare: comparing general practice services in a tertiary and primary healthcare settings. Niger Heal J. 17(1): 264.
- Onyeonoro UU, Chukwu JN, Nwafor CC, Meka AO, Omotowo BI, et al. (2015) Evaluation of Patient Satisfaction with Tuberculosis Services in Southern Nigeria. Heal Serv Insights. 8: 25-33.
- Ali DA (2016) Patient satisfaction in Dental Healthcare centres. Eur J Dent. 10(3): 309-314.
- Donabedian A (1988) The quality of care: How can it be assessed? JAMA. 260(12): 1743–1748.
- Weiner BJ, Lewis CC, Stanick C, Powell BJ, Dorsey CN, et al. (2017) Psychometric assessment of three newly developed implementation outcome measures. Implementation Science. 12(1): 1-12.
- Laerd Statistics. Cronbach's Alpha (α) using SPSS Statistics.
- Malhotra, N. K. (2019) Marketing research: An applied orientation. 7th ed. Upper Saddle River, NJ: Pearson/Prentice Hall.
- Karandashev V, Evans ND (2017) Test of Implicit Associations in Relationship Attitudes (TIARA): Manual for a New Method. Springer.
- Abraham J, Barker K (2014) Exploring gender difference in motivation, engagement and enrolment behaviour of senior secondary physics students in New South Wales. Research in Science Education. 45(1): 59-73.
- Field A (2016) Discovering Statistics Using IBM SPSS Statistics. 4th ed. London: Sage Publications Ltd.
- Glen S (2014) Weighted Mean: Formula: How to Find Weighted Mean.
- Singh S (2018) Why correlation does not imply causation?
- Laerd Statistics (2018) Testing for Normality using SPSS Statistics.
- Le Grand J, Robinson R (1983) The economics of social problems. Second edition. London: hlachlillan.
- Eyasu KH, Adane AA, Amdie FZ, Getahun TB, Biwota MA (2016) Adult Patients’ Satisfaction with Inpatient Nursing Care and Associated Factors in an Ethiopian Referral Hospital, Northeast, Ethiopia.
- Alhusban MA, Abualrub RF (2009) Patient satisfaction with nursing care in jordan. J Nurs Manag. 17(6): 749-758.
- Zarzycka D, Bartoń E, Mazur A, Turowski K (2019) Sociodemographic and medical factors associated with patients ’ satisfaction with nursing care and their perception of pain. Ann Agric Environ Med. 26(2): 298-303.
- Ibraheem WA, Ibraheem AB, Bekibele CO (2013) Sociodemographic predictors of patients’ satisfaction. 12(2): 87- 90.
- Ibraheem OM, Oyewole OE, Olaseha IO (2015) Experiences and perceptions of menopause among women in Ibadan South East Local Government Area, Nigeria. African J Biomed Res. 18(2): 81-94.
- Babatola OH, Popoola RO, Olatubi MI, Adewoyin FR (2022) Patients' Satisfaction with Health Care Services in Selected Secondary Health Care Facilities in Ondo State, Nigeria. Journal of Family Medicine and Disease Prevention Open Access Citation. 8(1): 145.