


Majed Ramadan1, Doaa Aboalola1, Raghad Alzahrani2, Shahad Alasiri2, Hala Althomali2, Khulood Alsiary3, Mohieeldin Elsayid2, Rawiah Alsiary1*
1King Abdullah International Medical Research Center (KAIMRC), Jeddah, Saudi Arabia/King Saud bin Abdulaziz University for Health Sciences (KSAU-HS), Jeddah, Saudi Arabia.
2Faculty of Applied Medical Sciences, King Saud bin Abdulaziz University for Health Sciences (KSAU-HS), Jeddah, Saudi Arabia.
3Family Medicine Department, National Guard Health Affairs, Prince Mohammad ben Abdul-Aziz Hospital. King Saud bin Abdulaziz University for Health Sciences (KSAU-HS), Jeddah, Saudi Arabia.
*Corresponding Author: Rawiah Alsiary, King Abdullah International Medical Research Center (KAIMRC), Jeddah, Saudi Arabia/King Saud bin Abdulaziz University for Health Sciences (KSAU-HS), Jeddah, Saudi Arabia.
Abstract
Background: The frequency of leukemia has been steadily rising in the Kingdom of Saudi Arabia during the last several years. In everyday practice, the information on survival rate to the age and types of leukemia is insufficient.
Objective: Therefore, the goal of this study was to determine the mortality factors and evaluate the overall clinical and epidemiological features of patients who were diagnosed with leukemia at Princess Norah Oncology Center.
Materials and Methods: A Retrospective analysis was conducted on the clinical and demographic data for patients diagnosed with leukemia, ranging in age from one to 81 years old, from 2015 to 2021 at the Princess Norah Oncology Center, King Abdulaziz Medical City, Western Region.
Results: The hazard ratio (HR) is 8.11 times higher for Acute Myeloid Leukemia (AML) patients compared to Acute Lymphoblastic Leukemia (ALL) patients. Also, according to the Kaplan-Meier survival curves, AML patients had worse overall survival than patients with ALL and other types of leukemia (APL, CLL, CML, and JMML). Unexpectedly, our findings showed that patients with abnormal cytogenetic mutations had a better survival rate than those with normal cytogenetic mutations.
Conclusions: Our study examined and defined the most common patterns of leukemia within the Saudi population at Princess Norah Oncology Center. It also identified prediction factors for mortality among our population.
Keywords: Leukemia, acute lymphatic leukemia, acute myeloid leukemia, mortality, demographic variables, clinical variables, Kingdom of Saudi Arabia.
Introduction
A form of cancer known as leukemia develops from the maturing myeloid and lymphoid stem cells in the bone marrow known as Hematopoietic stem cells [1]. Leukemia has four main types: Acute Myeloid Leukemia (AML), Chronic Lymphocytic Leukemia (CLL), Acute Lymphoblastic Leukemia (ALL), and Chronic Myeloid Leukemia (CML) [1]. These major types can be subdivided further as follows. ALL is classified as B-cell ALL and T-cell ALL by (WHO), the World Health Organization, based on gene and chromosomal alterations in leukemia cells. Moreover, the French American-British (FAB) classification divides AML into seven subtypes based on the type of cell from which the leukemia starts and how mature the cells are. This was mainly determined by how the leukemia cells appeared under the microscope following standard staining. In addition, there are two types of CLL that resemble one another but differ in the quantity of the proteins ZAP-70 and CD38. Furthermore, there are other more uncommon types of leukemia, such as myelodysplastic syndromes, hairy cell leukemia, and myeloproliferative disorders. Another chronic leukemia that begins in myeloid cells is chronic myelomonocytic leukemia (CMML) [2-6].
Leukemia is composed of heterogeneous populations of cells, much like solid tumors. These tumor cells' makeup may dramatically vary during and after therapy or relapse [7-9]. This heterogeneity is shown by the differences in patients' clinical presentations, cytomorphology, cytogenetics, treatment responses, and prognoses. Identifying distinct cell subpopulations within the various types of leukemia is required to understand leukemic mechanisms. Detecting which leukemic cell subpopulations are involved in leukemia development will result in multiple treatment strategies in clearly defined categories [6,10-12]. Recent reports suggest that leukemia has a high mortality rate worldwide [13-16]. The Saudi Cancer Registry declared in 2017 that leukemia came in fifth place among other types of cancer in the Saudi population, with increasing incidence among people of different ages, sexes, and regions [17]. Leukemia was present in 4.4% of women and 7.6% of men overall [17].
Because of advancements in diagnostic and therapeutic techniques over the last several decades, the survival rate for the majority of leukemia types has risen. The majority of childhood leukemia are considered cured after five years of remission since they are unlikely to recur after that time [18]. Based on the (NCI) National Cancer Institute, the relative 5-year survival rate for all types of leukemia is approximately 65% [18]. Regarding prognosis, the most critical factors are white blood cell count (WBC), cytogenetic results, and age [19-23]. In addition, leukemia is associated with a number of risk factors, such as smoking, chemical exposure, prior chemotherapy exposure, radiation exposure, rare congenital abnormalities, specific blood problems, age, and gender [24].
Furthermore, there was insufficient evidence in Saudi Arabia about the effectiveness of categorizing demographic and clinical characteristics, their impact on survival and mortality rates, and the prognosis of leukemia based on different ages, sexes, and cytogenetic or molecular profiles. Consequently, more research is needed. Thus, the current study aims to investigate leukemia trends and define the most common patterns of leukemia within the Saudi population of various ages and genders in a single center, Princess Norah Oncology Center at Western Region, using medical records from the BEST Care system from 2015 to 2021.
Material and Methods
Study Settings, Design, and Population
This retrospective cohort study used the Ministry of National Guard Health Affairs' (MNG-HA) data. The MNG-HA, with a 751-bed capacity, is a healthcare organization funded by the government of the Kingdom of Saudi Arabia, and it is affiliated with the Ministry of National Guard. It provides various clinical, academic, and research programs, from public health and primary care to the fine tertiary care specialties and sub-specialties. The medical city consists of a large oncology center that serves individuals living in Saudi Arabia from all regions. The current study used cancer registry unit data between 1/1/2015 to 31/12/2021. The registry includes all cancer patients' data for individuals diagnosed and treated at King Abdulaziz Medical City (KAMC) in Jeddah City, Western Province. Data include demographic and visit characteristics (age, gender, marital status, date of death, and date of last contact) and clinical characteristics (date of diagnosis, tumor histology, level of differentiation, stages, and cancer grades).
Princess Norah Oncology Center follows the World Health Organization's (WHO) leukemia protocols for leukemia diagnosis and tumor classification [25]. Categories, types, and subtypes of leukemia are classified according to WHO guidelines to increase levels of specificity. For instance, the lymphoblasts should make up more than 20% to 25% of the cells in a peripheral blood smear or bone marrow biopsy/aspirate to diagnose ALL. The treatment options in the Oncology Center for leukemia are influenced by various factors, such as the patient's overall health, age, and type and stage of leukemia. Common leukemia treatments are Chemotherapy, Immunotherapy, Radiation, Targeted therapy, and Bone marrow transplant.
Identification of patients
Ethical approval was obtained from the Local Institutional Review Board of the Saudi National Guard Health Affairs, Jeddah (JED-20- 427780-97365). All methods were performed in accordance with the relevant guidelines and regulations of KAIMRC. Informed consent for general treatment was obtained at admission. The patient's medical information was strictly confidential. All patients' identifying variables were omitted before the analysis. Study participant selection included all individuals diagnosed with leukemia cancer, International Classification of Diseases (ICD) (ICD-10 C95–C96) between 2015-2021, who were residing in Saudi Arabia and registered in MNG-HA hospitals system with follow-up to December 31, 2021. Four (0.7 %) of the 329 eligible patients were excluded due to unknown admission status, contact dates, or survival status.
Patient and Tumor Characteristics
Demographics such as age, gender, age at diagnosis, body mass index (BMI), and region were collected from the electronic medical records. Clinical data were also collected, including mutation and laboratory variables such as (hemoglobin level, red blood count (RBC), total white blood count (WBC), and platelet count). Types and subtypes of leukemia, complex karyotype, and transplantation were also documented. Other variables were also collected, like comorbidity such as (cardiovascular disease, obesity or underweight, diabetes, pulmonary disease, hypertension, coronary disease, renal failure, hepatic failure, asthma, anxiety, depression, behavioral problems and sleep disorder in children), family history, COVID19 infection status during the patients' follow-up in 2019-2020, relapse, easy bleeding from nose and gum bleeding due to low platelets count, infection status, such as whether the patients had symptoms that could have been caused by a bacterial, viral, or fungal infection, swallow lymph node which is defined as enlargement of one or more lymph nodes due impairment in the immune system caused by inflammatory conditions.
The cellularity of the bone marrow was determined by estimating the ratio of hematopoietic cells to fat; 25-75% of hematopoietic cells is considered a normal range.
Outcome Variable
The primary outcome variable was death status. The follow-up period began on the date of leukemia diagnosis recorded in the registry and finished either on the date of death, the last contact, or the study end date (December 31, 2021), whichever came first. Completeness of follow-up was computed at each time interval using Clark's completeness index (CCI) and a simplified person-time (SPT) method [26,27]. The resulting CCI and SPT were 84.22% and 80.77% respectively.
Statistical Analysis
Demographics, mutation status, and clinical and laboratory characteristics were evaluated across right- and left-sided mCRC tumors using Chi-square and Fisher exact tests. Purposeful variable selection was used in the multivariate analyses for model building [28]. All variables with a P value of less than 0.3 were kept via backward elimination. The log-rank test for all-cause mortality was used to evaluate the differences between curves and estimate the survival rates using the Kaplan-Meier product-limit method. We further stratified the Kaplan-Meier survival curve by cytogenetic mutation to examine the difference in survival between those with and without cytogenetic mutation. We employed Cox proportional hazards regression models to calculate the variations in all-cause mortality across the various leukemia types. Firth's Correction for Monotone Likelihood was applied to account for the small sample size and eliminate any potential bias [29, 30]. Results were deemed statistically significant at P < 0.05; all statistical tests were two-sided. Version 9.4 of SAS statistical software was used for all the analyses.
Results
329 patients diagnosed with leukemia were included in the study. Acute lymphatic leukemia (ALL) accounts for the majority of leukemia patients (79.0%), followed by acute myeloid leukemia (AML) for 16.72%, and other types of leukemia account for 4.2% (APL, CLL, CML, and JMML). Patients' mean and median age for ALL, AML, and other types of leukemia were 11.8 (10%), 26.4 (17%), and 40 (52%), respectively. For patients diagnosed with ALL, 80.38% were youth (1 to 15 years old), 58.08% were male, 65.3% were underweight, 80.7% were diagnosed at age 1 to 12 years old, 70.8% lived in the North/Western region, 74.6% had comorbidity, 96.3% received treatment, and 61.9% had a family history of cancer. The same patterns were observed among AML and other types of leukemia (Table 1). In addition, 6.4% of all leukemia patients were positive for the COVID-19 virus (Table 1). ALL patients had a higher survival rate compared to AML, as one-fourth of AML patients died (25.4%) compared to (6.9%) of ALL patients (Table 1). However, other types of leukemia had the highest relapse rate (21.4%), followed by ALL (19.2%) (Table 1).
Table 2 presents the clinical characteristics of the different types of leukemia. AML patients experienced the most pronounced symptoms in which they had the highest prevalence of easy bleeding (38.1%), Infection status (89.0%), swallowing lymph nodes (58.1%), losing appetite and weight (45.4%), high bone marrow results (69.0%), high hemoglobin at diagnosis (1.8%), and high white blood cells count (45.4%) compared to ALL and other types of leukemia. In contrast, red blood cell count, platelets, and transplantation were the highest among ALL patients (2.6%, 2.3%, and 37.3%, respectively) (Table 2).
Moreover, APL, CLL, CML, and JMML patients had the highest rate of at least one genetic mutation (64.29%). While complex karyotype and abnormal cytogenetic mutation were the most common among ALL patients (15 % and 72.3 %, respectively) (Table 2). In terms of specific deleterious genetic mutations, AML patients had a higher rate of FLT3 and RUNX1 mutations (36.3% and 12.7%, respectively), while other types of leukemia had higher JAK2 mutations (7.6%) compared to ALL and AML patients. Finally, ALL patients had a higher rate of ETV6 mutations (11.5%) compared to AML and other types of leukemia. In addition, the multivariate analysis in Table 3 showed that older ages were 1.02 more likely to die (95% CI, 1.005, 1.04; P = 0.01) while HR for patients with AML was 8.11 higher compared to ALL patients (95% CI, 3.46, 18.96; P = 0.0001) (Table 3).
Table 1: Demographic characteristics of leukemia patients by leukemia type at an Oncology Center in the Western Region of Saudi Arabia (2015- 2021)
|
|
Acute lymphocytic |
Acute myeloid leukemia (AML) |
Other (APL, CLL, CML, |
p-value 2 |
|
|
n (%)1 |
n (%) |
n (%) |
|
|
Total |
260 (79.0) |
55 (16.7) |
14 (4.2) |
|
|
Age mean (median) 4 |
11.8 (10) |
26.4 (17) |
40 (52) |
<.0001 |
|
Age |
|
|
|
|
|
1 to 15 years old |
209 (80.3) |
26 (47.2) |
5 (35.7) |
<.0001 |
|
16 to 60 years old |
51 (19.6) |
29 (52.7) |
9 (64.2) |
|
|
Gender |
|
|
|
|
|
Male |
151 (58.0) |
36 (65.4) |
9 (64.2) |
.01 |
|
Female |
109 (41.9) |
19 (34.5) |
5 (35.7) |
|
|
BMI |
|
|
|
|
|
<18.5 underweight |
170 (65.3) |
35 (63.6) |
6 (42.8) |
<.0001 |
|
18.5-24.9 normal |
54 (20.7) |
15 (27.2) |
4 (28.5) |
|
|
25-29.9 overweight |
26 (10.0) |
5 (9.0) |
4 (28.5) |
|
|
30 or > obese |
------ |
------ |
------ |
|
|
Age at diagnosis |
|
|
|
|
|
1-12 years old |
210 (80.7) |
39 (70.9) |
8 (57.1) |
0.03 |
|
13-20 years old |
24 (9.2) |
4 (7.2) |
1 (7.1) |
|
|
20-60 years old |
20 (7.6) |
9 (16.3) |
3 (21.4) |
|
|
>60 years old |
6 (2.3) |
3 (5.4) |
2 (14.2) |
|
|
Region |
|
|
|
|
|
Central region |
6 (1.8) |
------ 6 |
------ |
0.001 |
|
North/Western region |
233 (70.8) |
54 (98.1) |
12 (85.7) |
|
|
South region |
18 (6.9) |
1 (1.8) |
2 (14.2) |
|
|
Others |
3 (0.9) |
------ |
------ |
|
|
Comorbidity |
|
|
|
|
|
Yes |
194 (74.6) |
44 (80.0) |
13 (92.8) |
0.009 |
|
No |
66 (25.3) |
11 (20.0) |
1 (7.1) |
|
|
Family History of cancer |
|
|
|
|
|
Yes |
161 (61.9) |
38 (69.0) |
8 (57.1) |
0.001 |
|
No |
96 (36.9) |
17 (30.9) |
5 (35.7) |
|
|
NA3 |
3 (1.1) |
------ |
1 (7.1) |
|
|
Received treatment |
|
|
|
|
|
Yes |
251 (96.5) |
54 (98.1) |
13 (92.8) |
0.09 |
|
No |
9 (3.4) |
1 (1.8) |
1 (7.1) |
|
|
Covid-19 infection |
|
|
|
|
|
Yes |
12 (4.6) |
1 (1.8) |
----- |
0.12 |
|
No |
248 (95.3) |
54 (98.1) |
14 (100) |
|
|
Patient status |
|
|
|
|
|
Death |
18 (6.9) |
14 (25.4) |
2 (14.9) |
<.0001 |
|
Alive |
242 (93.0) |
41 (74.5) |
12 (85.7) |
|
|
Relapse |
|
|
|
|
|
Yes |
50 (19.2) |
9 (16.3) |
3 (21.4) |
0.03 |
|
No |
210 (80.7) |
46 (83.6) |
11 (78.5) |
|
|
1 “n” sample size, % percentage 2 Fisher exact test for less than 5 frequency per cell and Chi-square test for more than 5 frequency per cell 3 “NA” Not available 4 ANOVA test 5 Chronic lymphocytic leukemia (CLL), Acute promyelocytic leukemia (APL), Chronic myelogenous leukemia (CML), and Juvenile myelomonocytic leukemia (JMML) 6 zero observation |
||||
Table 2: Clinical characteristics of leukemia patients by leukemia type at an Oncology Center in the Western Region of Saudi Arabia (2015-2021)
|
|
Acute lymphocytic |
Acute myeloid leukemia (AML) |
Other (APL, CLL, CML, and JMML)4 |
p-value 2 |
|
|
n (%)1 |
n (%) |
n (%) |
|
|
Total |
260 (79.0) |
55 (16.7) |
14 (4.2) |
|
|
Easy bleeding |
|
|
|
|
|
Yes |
87 (33.4) |
21 (38.1) |
3 (21.4) |
0.005 |
|
No |
169 (65) |
34 (61.8) |
11 (78.5) |
|
|
Not mentioned |
4 (1.5) |
----- |
----- 5 |
|
|
Infection status |
|
|
|
|
|
Yes |
199 (76.5) |
49 (89.0) |
9 (64.2) |
0.0001 |
|
No |
61 (23.4) |
6 (10.9) |
4 (28.5) |
|
|
Not mentioned |
----- |
----- |
1 (7.1) |
|
|
Swallow lymph nodes |
|
|
|
|
|
Yes |
137 (52.6) |
32 (58.1) |
5 (35.7) |
0.0010 |
|
No |
119 (45.7) |
23 (41.8) |
8 (57.1) |
|
|
Not mentioned |
4 (1.5) |
----- |
1 (7.1) |
|
|
Losing appetite and weight |
|
|
|
|
|
Yes |
99 (38.0) |
25 (45.4) |
2 (14.2) |
.0003 |
|
No |
156 (60.0) |
29 (52.7) |
11 (78.5) |
|
|
Not mentioned |
5 (1.9) |
1 (1.8) |
1 (7.1) |
|
|
Bone marrow cellularity results |
|
|
|
|
|
Hypercellular marrow |
168 (64.6) |
38 (69.0) |
9 (64.2) |
.0003 |
|
hypocellular marrow |
74 (28.4) |
17 (30.9) |
4 (28.5) |
|
|
Normal cellularity |
18 (6.9) |
----- |
1 (7.1) |
|
|
Hemoglobin at diagnosis |
|
|
|
|
|
High (14.5gm/dL>) |
2 (0.7) |
1 (1.8) |
----- |
<.0001 |
|
Low (10.6gm/dL<) |
247 (95.0) |
51 (92.7) |
9 (64.2) |
|
|
Normal (10.6-14.5gm/dL)
|
11 (4.2) |
3 (5.4) |
5 (35.7) |
|
|
WBCs 2 count at diagnosis |
|
|
|
|
|
High (16.0x10^9/L>) |
84 (32.3) |
25 (45.4) |
4 (28.5) |
<.0001 |
|
Low (6.0x10^9/L<) |
114 (43.8) |
17 (30.9) |
4 (28.5) |
|
|
Normal (6.0-16.0x10^9/L) |
62 (23.8) |
13 (23.6) |
6 (42.8) |
|
|
RBCs 3 count at diagnosis |
|
|
|
|
|
High (5.6x10^12/L >) |
7 (2.69) |
1 (1.8) |
1 (7.1) |
<.0001 |
|
Low (3.5 x10^12/L <) |
215 (82.6) |
44 (80.0) |
6 (42.8) |
|
|
Normal (3.5-5.6x10^12/L) |
38 (14.6) |
10 (18.1) |
7 (50.0) |
|
|
Platelets counts at diagnosis |
|
|
|
|
|
High (450x10^9/L>) |
6 (2.3) |
----- |
----- |
0.0003 |
|
Low (150x10^9/L<) |
217 (83.4) |
44 (80.0) |
8 (57.1) |
|
|
Normal (150-450x10^9/L) |
37 (14.2) |
11 (20.0) |
6 (42.8) |
|
|
Transplantation |
|
|
|
|
|
Yes |
97 (37.3) |
18 (32.7) |
3 (21.43) |
0.0001 |
|
No |
102 (39.2) |
18 (32.7) |
7 (50.0) |
|
|
NA3 |
61 (23.4) |
19 (34.5) |
4 (28.5) |
|
|
Complex karyotype |
|
|
|
|
|
Yes |
39 (15.0) |
6 (10.9) |
1 (7.1) |
0.0008 |
|
No |
221 (85.0) |
49 (89.0) |
13 (92.8) |
|
|
Cytogenetics mutation |
|
|
|
|
|
Normal |
41 (15.7) |
12 (21.8) |
4 (28.5) |
0.0008 |
|
Abnormal |
188 (72.3) |
38 (69.0) |
9 (64.2) |
|
|
NA |
31 (11.9) |
5 (9.0) |
1 (7.1) |
|
|
At least one genetic mutation |
|
|
|
|
|
Yes |
147 (56.5) |
32 (58.1) |
9 (64.2) |
0.02 |
|
No |
113 (43.4) |
23 (41.8) |
5 (35.7) |
|
|
Specific deleterious genetic mutations |
|
|
|
|
|
ASXL1/DNMT3A/TET2/TP53/PTPN11 |
|
|
|
|
|
Yes |
----- |
1 (1.8) |
----- |
0.16 |
|
No |
260 (100) |
54 (98.1) |
13 (100) |
|
|
FLT3 |
|
|
|
|
|
Yes |
2 (0.7) |
20 (36.3) |
----- |
0.0001 |
|
No
|
258 (99.2)
|
35 (63.6)
|
13 (100)
|
|
|
RUNX1 |
|
|
|
|
|
Yes |
29 (11.1) |
7 (12.7) |
----- |
0.03 |
|
No |
231 (88.8) |
48 (87.2) |
13 (100) |
|
|
ETV6 |
|
|
|
|
|
Yes |
30 (11.5) |
1 (1.8) |
----- |
0.003 |
|
No |
230 (88.4) |
54 (98.1) |
13 (100) |
|
|
JAK2 |
|
|
|
|
|
Yes |
1 (0.30) |
1 (1.8) |
1 (7.6) |
0.0319 |
|
No |
259 (99.6) |
54 (98.1) |
12 (92.3) |
|
|
1 “n” sample size, % percentage 2 Fisher exact test for less than 5 frequency per cell and Chi-square test for more than 5 frequency per cell 3 “NA” Not available 4 chronic lymphocytic leukemia (CLL), Acute promyelocytic leukemia (APL), Chronic myelogenous leukemia (CML), and Juvenile myelomonocytic leukemia (JMML) 5 zero observation |
||||
Table 3: Hazard ratio of leukemia patients’ all-cause death at an Oncology Center in the Western Region of Saudi Arabia (2015-2021) (Multivariate analyses)
|
|
n (%) |
AHR 1 |
95% CI 2 |
P-value 4 |
|
Age |
329 (100) |
1.02 |
(1.005, 1.04) |
0.01 |
|
BMI |
|
|
|
|
|
Normal |
73 (22.19) |
Ref 3 |
Ref |
|
|
Underweight |
211 (64.13) |
2.83 |
(0.88, 9.07) |
0.07 |
|
Obese /overweight |
35 (10.64) |
0.46 |
(0.09. 2.22) |
0.33 |
|
Not mentioned |
10 (3.05) |
4.11 |
(0.84, 20.03) |
0.07 |
|
Leukemia types |
|
|
|
|
|
Acute lymphocytic leukemia (ALL) |
260 (79.03) |
Ref |
Ref |
|
|
Acute myeloid leukemia (AML) |
55 (16.72) |
8.11 |
(3.46, 18.96) |
<.0001 |
|
Other (APL, CLL, CML, and JMML) |
14 (4.26) |
4.46 |
(0.85, 23.46) |
0.077 |
|
Cytogenetics mutation |
|
|
|
|
|
Normal |
57 (17.33) |
Ref |
Ref |
|
|
Abnormal |
235 (71.43) |
5.1 |
(0.67, 38.4) |
0.11 |
|
NA5 |
37 (11.25) |
8.93 |
(0.98, 80.21) |
0.06 |
|
Transplantation |
|
|
|
|
|
Yes |
118 (35.87) |
0.52 |
(0.20, 1.35) |
0.18 |
|
No |
127 (38.6) |
Ref |
Ref |
|
|
NA |
84 (25.53) |
|
|
|
|
RBCs count at diagnosis |
|
|
|
|
|
High (5.6x10^12/L >) |
9 (2.74) |
1.99 |
(0.21, 4.24) |
0.32 |
|
Low (3.5 x10^12/L <) |
265 (80.55) |
1.33 |
(0.81, 2.56) |
0.44 |
|
Normal (3.5-5.6x10^12/L) |
55 (16.72) |
Ref |
Ref |
|
|
WBCs count at diagnosis |
|
|
|
|
|
High (16.0x10^9/L>) |
113 (34.35) |
1.91 |
(0.65, 5.57) |
0.23 |
|
Low (6.0x10^9/L<) |
135 (41.03) |
1.33 |
(0.51, 3.48) |
0.56 |
|
Normal (6.0-16.0x10^9/L) |
81 (24.62) |
Ref |
Ref |
|
|
Losing apatite |
|
|
|
|
|
Yes |
126 (38.3) |
Ref |
Ref |
|
|
No |
203 (61.7) |
0.85 |
(0.34, 2.12) |
0.79 |
|
Family history of cancer |
|
|
|
|
|
Yes |
207 (62.92) |
1.12 |
(0.44, 2.85) |
|
|
No |
122 (37.08) |
Ref |
Ref |
0.94 |
|
1 Adjusted hazard ratio 2 Confidence interval 3 Reference 4 Multivariate Cox regression analysis 5 “NA” Not available |
||||
Survival curves using the Kaplan-Meier for different types of leukemia patients were evaluated. Patients with AML had a shorter median overall survival of 33 months (95 percent CI, 19-41 months) compared to 38 months (95 percent CI, 34-45 months) for patients with ALL and 46 months for other types of leukemia (95 percent CI, 18-65 months, P = 0.059) (Figure 1). The Kaplan-Meier survival analysis for patients with normal and abnormal cytogenetic surprisingly showed that patients with abnormal cytogenetic mutations had a longer median overall survival of 39 months (95 percent CI, 33-46 months), while patients with normal cytogenetic mutations had a median overall survival of 33 months (95 percent CI, 19-38 months, P = 0.0007) (Figure 2).
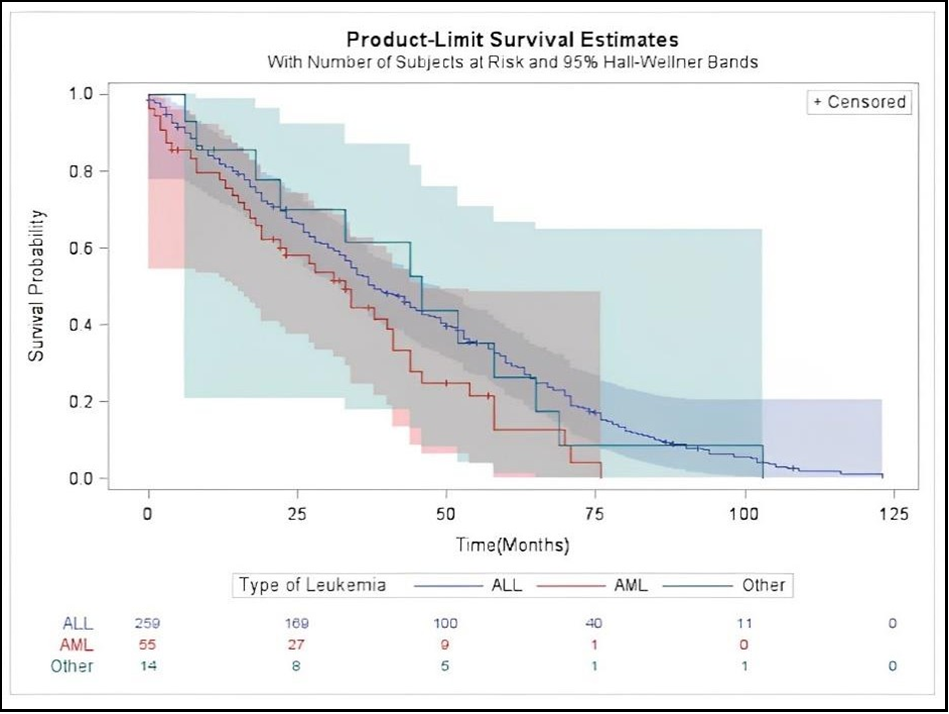
Figure 1: Kaplan-Meier Survival Curves Comparing Survival for Patients with ALL, AML and other type of leukemia
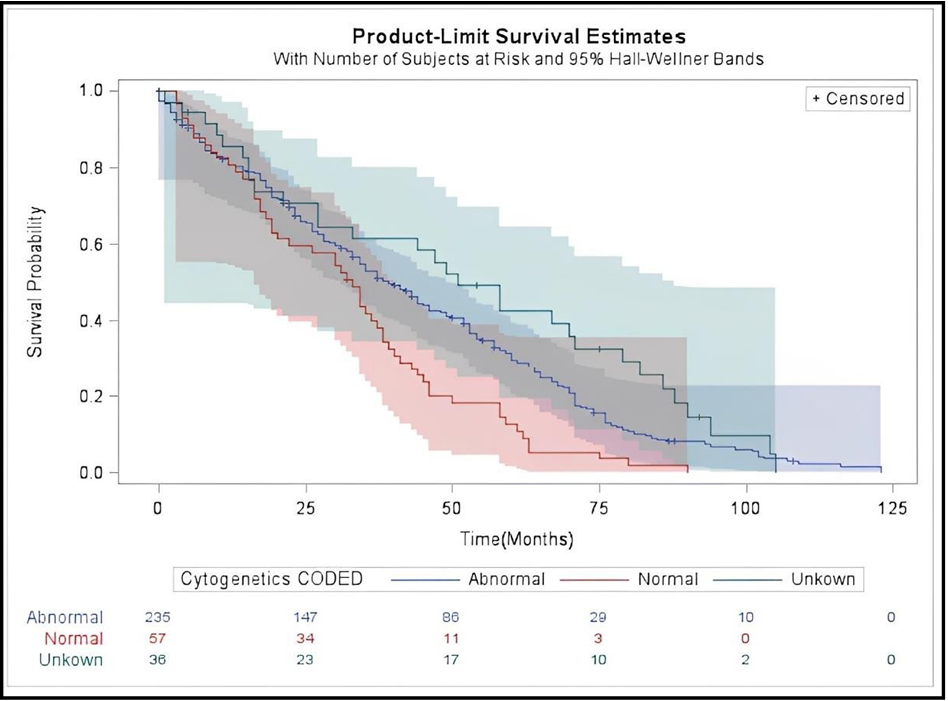
Figure 2: Kaplan-Meier Survival Curves Comparing Survival for Patients with abnormal, and normal cytogenetic mutation.
Discussion
This study measures clinical and epidemiological characteristics of leukemia patterns in Saudi Arabia's Western region. The study included 329 patients who had been diagnosed with leukemia; the majority of patients were ALL. Given that, ALL is the most common type of leukemia in children worldwide [31]. We revealed that 80% of the participants in this study were children, implying that most of the cases were ALL. Also, we have reported that the median age of patients with AML is deficient compared to other populations [31- 33]; the demographic, genetic mutations, and other environmental factors might cause the differences between Middle Eastern and Western populations. It will be interesting to investigate the age- adjusted incidence rate of leukemia in our population in the upcoming research consideration. However, the population in the current study can't be generalized to the entire population as this is a single oncology center serving 20-30% of the whole cancer population in the Kingdom.
The purpose is to assess whether these features affect the survival patterns of all leukemia patients from all age groups. Our findings revealed that ALL patients had the most extended survival rate compared with AML and patients with other types of leukemia (APL, CML, CLL, and JMML), which complemented a study done in 2018 by Omair et al. Their analysis showed that the 10-year survival rate for ALL patients was higher (92%) [34]. In addition, another study that was done from a single tertiary care facility in Pakistan also confirmed that the 10-year survival rate for ALL patients was high (83%) [35]. On the other hand, when analyzing the cause of death in leukemia patients, our study demonstrated that AML has almost 8 times higher risk of death compared to ALL patients. According to a survey conducted by the Dutch Childhood Oncology Group, 2.6% of ALL patients and 19.2% of AML patients deaths were in children [36].
The age of the patients is the second significant predictor of leukemia cause of death after the leukemia type, with the older population of all kinds of leukemia having the worst outcomes. In a study conducted by Hossain et al., it was demonstrated that ALL children had lower mortality rates than older age groups, continuously representing decreased survival rates [22]. Moreover, both types of acute leukemia showed poor response and low survival rates with ages more than 16 years [23]. The age at which the tumor is diagnosed is a significant prediction factor of leukemia survival, as early detection is critical for higher survival due to early treatment administration. However, there is no clear explanation of how age-dependent biological and environmental factors affect this connection. Therefore, more investigation is necessary to understand the causes fully.
Cytogenetic investigations are critical for defining the disease severity and prognosis. Our findings also found significant statistical variations in the overall survival rate among patients with abnormal and normal cytogenetic profiles. The overall survival median for patients with abnormal cytogenetic profiles was longer by 39 months, while patients with normal cytogenetic had lower overall survival by 33 months. However, there is a contradictive outcome in the literature in which some researchers stated that patients with abnormal cytogenetics and patients with a normal karyotype had similar survival rates (both P > 0.6) [37]. At the same time, others reported that patients with abnormal cytogenetics had the worst prognosis and significantly shorter RFS and OS [19,38]. We found that abnormal cytogenetics were the most prevalent among ALL patients and related to a better outcome. This is explained by the fact that more than 80% of ALL patients were children, according to our findings. The majority of pediatric leukemia cases are declared cured after five years [18], which justifies the higher survival rate. However, this finding contradicts what is reported in an article written by Al-Balwi et al., that the abnormal cytogenetic features had a significant impact on the survival of ALL children, and their death risk increased by more than five folds [39]. Therefore, further research is warranted to investigate the impact of cytogenetics abnormality on disease progression in an age-adjusted study.
Our findings suggest that ETV6 mutations are mainly reported in ALL individuals. This mutation was found in only around 1% of AML patients and was never reported in the other group. Mutations Associated with ETV6 have also been reported in children with T- ALL [40] and patients with B-ALL [41], but they are rare yet recurring occurrences in AML patients [42,43]. On the other hand, our study showed that FLT3 mutation was mainly reported in AML individuals. This result is consistent with previous findings that stated that mutations in FLT3 were frequent in AML patients [44,45]. RUNX1 mutation was detected in ALL and AML patients in the current study but never in the other group. ETV6 and RUNX1 fusions are observed in 22% of children with ALL, making it the most prevalent cytogenetic subgroup in pediatric ALL [40].
Furthermore, RUNX1 somatic mutations have been reported often in AML and ALL in several studies [47]. In line with our findings, JAK2 mutations have infrequently been found in lymphoid malignancies. This mutation has only been seen in a few CLL cases [47,48].
In Summary, our study described and analyzed leukemia trends and defined the most prevalent types and patterns of leukemia over the period 2015 –2021 within the Saudi population in a single institution in the Western region and identified the type of leukemia and age as predicted factors for patient's death among leukemia patients. However, we acknowledge that this study has significant limitations to consider. First, the retrospective research design of the study, along with a small number of patients from a single cohort and an uncontrolled methodology with potential selection bias, limits the generalization of our findings to other patient populations. Our results should be confirmed in a more extensive future study. Additionally, the unavailability of standard developmental curves may result in inaccuracy of the correct measurements.
Moreover, the slight sample size restriction might have caused an underestimation of the predictive outcome of leukemia types. Second, there was missing information in several variables coded as "Not mentioned." These data would have permitted further analysis and evaluation of the predictive value of essential factors in specific subgroups, particularly transplantation.
Conclusion
In an oncology center serving the Saudi population in the Western region, our study looked at and outlined the most prevalent leukemia pattern types. Additionally, it revealed mortality risk factors for our demographic. The results from this study warrant the further investigation of leukemia prognostic factors that affect patients' survival and long-term outcome.
Conflict of Interest: The authors declare that the research was conducted without any commercial or financial relationships that could be construed as a potential conflict of interest.
Acknowledgments: We thank King Abdullah International Medical Center (KAIMRC) and King Saud bin Abdulaziz University for Health Sciences (KSAU-HS) for their financial support.
Data Availability Statement: The data supporting this study's findings are available from King Abdullah International Medical Research Center (KAIMRC). However, restrictions apply to the availability of these data, which were used under license for the current study and are not publicly available. Data are, however, available from the authors upon reasonable request and with permission of King Abdullah International Medical Research Center (KAIMRC).
References
- Chennamadhavuni A, Lyengar V, Mukkamalla SKR, Shimanovsky A (2022) Leukemia. StatPearls.
- Arber DA, Hasserjian RP, Orazi A, Mathews V, Roberts AW, et al. (2022) Classification of myeloid neoplasms/acute leukemia: Global perspectives and the international consensus classification approach. Am J Hematol. 97(5): 514-518.
- Marinescu C, Vlădăreanu AM, Mihai F (2015) Acute Lymphocytic Leukemia in Adults. Pathologic Features and Prognosis. Romanian journal of internal medicine = Revue roumaine de medecine interne. 53(1): 31-6.
- Kline KAF, Kallen ME, Duong VH, Law JY (2021) Acute Lymphoblastic Leukemia and Acute Lymphoblastic Lymphoma: Same Disease Spectrum but Two Distinct Diagnoses. Curr Hematol Malig Rep. 16(5): 384-393.
- Hallek M, Cheson BD, Catovsky D, Caligaris-Cappio F, Dighiero G, et al. (2008) Guidelines for the diagnosis and treatment of chronic lymphocytic leukemia: a report from the International Workshop on Chronic Lymphocytic Leukemia updating the National Cancer Institute-Working Group 1996 guidelines. Blood. 111(12): 5446-56.
- Lilleyman JS (1997) Leukaemia Diagnosis. A Guide to the FAB Classification. J Clin Pathol. 44(10): 879.
- Yan L, Ping N, Zhu M, Sun A, Xue Y, et al. (2012) Clinical, immunophenotypic, cytogenetic, and molecular genetic features in 117 adult patients with mixed-phenotype acute leukemia defined by WHO-2008 classification. Haematologica. 97(11): 1708-12.
- Ding L, Ley TJ, Larson DE, Miller CA, Koboldt DC, et al. (2012) Clonal evolution in relapsed acute myeloid leukaemia revealed by whole-genome sequencing. Nature. 481(7382): 506-10.
- Quesada AE, Hu Z, Routbort MJ, Patel KP, Luthra R, et al. (2018) Mixed phenotype acute leukemia contains heterogeneous genetic mutations by next-generation sequencing. Oncotarget. 9(9): 8441- 8449.
- Bennett JM, Catovsky D, Daniel MT, Flandrin G, Galton DA, et al. (1976) Proposals for the classification of the acute leukaemias. French-American-British (FAB) co-operative group. Br J Haematol. 33(4): 451-8.
- Bennett JM, Catovsky D, Daniel MT, Flandrin G, Galton DA, et al. (1985) Proposed revised criteria for the classification of acute myeloid leukemia. A report of the French-American-British Cooperative Group. Ann Intern Med. 103(4): 620-5.
- McCulloch EA, Kelleher CA, Miyauchi J, Wang C, Cheng GY, et al. (1988) Heterogeneity in acute myeloblastic leukemia. Leukemia. 2(12 Suppl): 38S-49S.
- Sung H, Ferlay J, Siegel RL, Laversanne M, Soerjomataram I, et al. (2021) Global Cancer Statistics 2020: GLOBOCAN Estimates of Incidence and Mortality Worldwide for 36 Cancers in 185 Countries. CA Cancer J Clin. 71(3): 209-249.
- Althubiti MA, Nour Eldein MM (2018) Trends in the incidence and mortality of cancer in Saudi Arabia. Saudi Med J. 39(12): 1259-1262.
- Global Burden of Disease Cancer Collaboration; Fitzmaurice C, Dicker D, Pain A, Hamavid H, Moradi-Lakeh M, et al. (2015) The Global Burden of Cancer 2013. JAMA Oncol. 1(4): 505-27.
- Koohi F, Salehiniya H, Shamlou R, Eslami S, Ghojogh ZM, et al. (2015) Leukemia in Iran: Epidemiology and Morphology Trends. Asian Pac J Cancer Prev. 16(17): 7759-7763.
- Alqahtani WS, Almufareh NA, Domiaty DM, Albasher G, Alduwish MA, Alkhalaf H, et al. (2020) Epidemiology of cancer in Saudi Arabia thru 2010-2019: a systematic review with constrained meta-analysis. AIMS Public Health. 7(3): 679-696.
- Polednak AP (1986) Recent trends in incidence and mortality rates for leukemias, and in survival rates for childhood acute lymphocytic leukemia, in Upstate New York. Cancer. 57(9): 1850-8.
- Chennamaneni R, Gundeti S, Konatam ML, Bala S, Kumar A, et al. (2018) Impact of cytogenetics on outcomes in pediatric acute lymphoblastic leukemia. South Asian J Cancer. 7(4): 263-266.
- Byrd JC, Mrózek K, Dodge RK, Carroll AJ, Edwards CG, et al. (2002) Pretreatment cytogenetic abnormalities are predictive of induction success, cumulative incidence of relapse, and overall survival in adult patients with de novo acute myeloid leukemia: results from Cancer and Leukemia Group B (CALGB 8461). Blood. 100(13): 4325-36.
- Schlenk RF, Kayser S, Morhardt M, Döhner K, Döhner H, et al. (2005) Pretreatment Cytogenetic Abnormalities Are Predictive of Induction Success, Cumulative Incidence of Relapse and Overall Survival in Patients >60 Years of Age with Newly Diagnosed Acute Myeloid Leukemia. Blood. 106(11): 3293.
- Hossain MJ, Xie L, McCahan SM (2014) Characterization of pediatric acute lymphoblastic leukemia survival patterns by age at diagnosis. Journal of cancer epidemiology. 2014: 865979.
- Holmes L, Opara F, Des-Vignes-Kendrick M, Hossain J (2012) Age Variance in the Survival of United States Pediatric Leukemia Patients (1973–2006). ISRN Public Health. 2012: 721329.
- Huang J, Chan SC, Ngai CH, Lok V, Zhang L, et al. (2022) Disease Burden, Risk Factors, and Trends of Leukaemia: A Global Analysis. Front Oncol. 12: 904292.
- Alaggio R, Amador C, Anagnostopoulos I, Attygalle AD, Araujo IBO, et al. (2022) The 5th edition of the World Health Organization Classification of Haematolymphoid Tumours: Lymphoid Neoplasms. Leukemia. 36(7): 1720-1748.
- Clark TG, Altman DG, De Stavola BL (2002) Quantification of the completeness of follow-up. Lancet. 359(9314): 1309-10.
- Xue X, Agalliu I, Kim MY, Wang T, Lin J, et al. (2017) New methods for estimating follow-up rates in cohort studies. BMC Med Res Methodol. 17(1): 155.
- von Allmen RS, Weiss S, Tevaearai HT, Kuemmerli C, Tinner C, et al. (2015) Completeness of Follow-Up Determines Validity of Study Findings: Results of a Prospective Repeated Measures Cohort Study. PloS one. 10(10): e0140817.
- Bursac Z, Gauss CH, Williams DK, Hosmer DW (2008) Purposeful selection of variables in logistic regression. Source Code Biol Med. 3: 17.
- Heinze G, Schemper M (2001) A solution to the problem of monotone likelihood in Cox regression. Biometrics. 57(1): 114-9.
- Deschler B, Lubbert M (2006) Acute myeloid leukemia: epidemiology and etiology. Cancer. 107(9): 2099-107.
- Shallis RM, Wang R, Davidoff A, Ma X, Zeidan AM (2019) Epidemiology of acute myeloid leukemia: Recent progress and enduring challenges. Blood Rev. 36: 70-87.
- Forman D, Stockton D, Møller H, Quinn M, Babb P, et al. (2003) Cancer prevalence in the UK: results from the EUROPREVAL study. Ann Oncol. 14(4): 648-54.
- Al Omari A, Hussein TA, Albarrak KA, Habib ARK, Sambas AA, et al. (2018) Clinical characteristics and outcomes of acute lymphoblastic leukaemia in children treated at a single tertiary hospital in Riyadh, Saudi Arabia. Journal of Health Specialties. 6(1): 14.
- Mushtaq N, Fadoo Z, Naqvi A (2013) Childhood acute lymphoblastic leukaemia: experience from a single tertiary care facility of Pakistan. JPMA The Journal of the Pakistan Medical Association. 63(11): 1399-404.
- Slats AM, Egeler RM, van der Does-van den Berg A, Korbijn C, Hählen K, et al. (2005) Causes of death--other than progressive leukemia--in childhood acute lymphoblastic (ALL) and myeloid leukemia (AML): the Dutch Childhood Oncology Group experience. Leukemia. 19(4): 537-44.
- Byrd JC, Mrózek K, Dodge RK, Carroll AJ, Edwards CG, et al. (2002) Pretreatment cytogenetic abnormalities are predictive of induction success, cumulative incidence of relapse, and overall survival in adult patients with de novo acute myeloid leukemia: results from Cancer and Leukemia Group B (CALGB 8461). Blood. 100(13): 4325-36.
- Lazaryan A, Dolan M, Zhang MJ, Wang HL, Kharfan-Dabaja MA, et al. (2021) Impact of cytogenetic abnormalities on outcomes of adult Philadelphia-negative acute lymphoblastic leukemia after allogeneic hematopoietic stem cell transplantation: a study by the Acute Leukemia Working Committee of the Center for International Blood and Marrow Transplant Research. Haematologica. 106(8): 2295-6.
- Chen Y, Cortes J, Estrov Z, Faderl S, Qiao W, et al. (2011) Persistence of cytogenetic abnormalities at complete remission after induction in patients with acute myeloid leukemia: prognostic significance and the potential role of allogeneic stem- cell transplantation. J Clin Oncol. 29(18): 2507-13.
- Al-Balwi AM, Binmahfoz S, AL-Raddadi RM, Al-Trabolsi HA, Baothman AA, et al. (2017) Prognostic Factors for Outcome of Childhood Lymphoblastic Leukemia At Cancer Centers in Jeddah. Int J Med Res Prof. 3(6): 195-202.
- Mullighan CG (2012) The molecular genetic makeup of acute lymphoblastic leukemia. Hematology Am Soc Hematol Educ Program. 2012: 389-96.
- Wang Q, Dong S, Yao H, Wen L, Qiu H, et al. (2014) ETV6 mutation in a cohort of 970 patients with hematologic malignancies. Haematologica. 99(10): e176-8.
- Silva FP, Morolli B, Storlazzi CT, Zagaria A, Impera L, et al. (2008) ETV6 mutations and loss in AML-M0. Leukemia. 22(8): 1639-43.
- Barjesteh van Waalwijk van Doorn-Khosrovani S, Spensberger D, de Knegt Y, Tang M, Löwenberg B, et al. (2005) Somatic heterozygous mutations in ETV6 (TEL) and frequent absence of ETV6 protein in acute myeloid leukemia. Oncogene. 24(25): 4129-37.
- Bolouri H, Farrar JE, Triche T Jr, Ries RE, Lim EL, et al. (2018) The molecular landscape of pediatric acute myeloid leukemia reveals recurrent structural alterations and age-specific mutational interactions. Nat Med. 24(1): 103-112.
- Papaemmanuil E, Gerstung M, Bullinger L, Gaidzik VI, Paschka P, et al. (2016) Genomic Classification and Prognosis in Acute Myeloid Leukemia. The New England journal of medicine. 374(23): 2209-2221.
- Osato M, Yanagida M, Shigesada K, Ito Y (2001) Point mutations of the RUNx1/AML1 gene in sporadic and familial myeloid leukemias. International journal of hematology. 74(3): 245-251.
- Yang YN, Qin YW, Wang C (2014) JAK2 V617F detected in two B-cell chronic lymphocytic leukemia patients without coexisting Philadelphia chromosome-negative myeloproliferative neoplasms: A report of two cases. Oncol Lett. 8(2): 841-844.
- Kodali S, Chen C, Rathnasabapathy C, Wang JC (2009) JAK2 mutation in a patient with CLL with coexistent myeloproliferative neoplasm (MPN). Leuk Res. 33(12): e236-9.