


Devjyoti Dalal1, Pramila Thapa2, V. Seenu1, Sujata Mohanty3, Sandeep Mathur4, Piyush Ranjan1, Showket Hussain5, Shivam Pandey6, Hemanga K. Bhattacharjee1, Dalip Singh Mehta2* and Anurag Srivastava7
1Department of Surgical Disciplines, All India Institute of Medical Sciences (AIIMS), New Delhi-110029, India
2Bio-Photonics and Green Photonics Laboratory, Department of Physics, Indian Institute of Technology, New Delhi-110016, India
3Stem Cell Facility, All India Institute of Medical Sciences (AIIMS), New Delhi-110029, India
4Department of Pathology, All India Institute of Medical Sciences (AIIMS), New Delhi-110029, India
5Division of Molecular Oncology & Head Molecular Diagnostics, National Institute of Cancer Prevention & Research, Noida - 201301, INDIA
6Department of Biostatistics, All India Institute of Medical Sciences (AIIMS), New Delhi-110029, India
7Retired Professor and Head, Surgical disciplines, All India Institute of Medical Sciences (AIIMS), New Delhi-110029, India
*Corresponding Author: Dalip Singh Mehta, Bio-Photonics and Green Photonics Laboratory, Department of Physics, Indian Institute of Technology, New Delhi-110016, India.
Abstract
Traditional techniques like mammography and ultrasound for screening and detection of breast cancer have limitations, and therefore, one may need to go through a breast biopsy to establish a diagnosis. Additionally, during the intraoperative procedure of breast cancer it is necessary to assess the tumour margin so that the complete removal of tumour cell is guaranteed. Several non- invasive techniques are currently being explored for detection of breast cancer through imaging or spectroscopy. Among them, the fluorescence spectroscopy is being widely explored as a real time, and non-invasive diagnostic tool. In this study, autofluorescence and fluorescence (fluorescein tagged) of resected breast tissue (cancer as well as normal) of 40 patients with common excitation wavelength of 490 nm were obtained and analysed. We found significant changes in spectra of cancer tissues compared to normal tissues, particularly red shift of 6.03 nm in breast cancer tissues in case of samples stained with exogenous fluorophore (fluorescein). The altered fluorescence peak intensity and peak wavelength could be attributed to changes in the tissue state due to physiological and pathological transformation during tumour transformation. Therefore, it is considered that fluorescence spectroscopy measurements are effective for detecting changes of fluorophore composition in tissue due to the development of cancer.
Keywords: Autofluorescence, breast cancer, fluorophores, emission spectra, tumour excision.
1. Introduction
Breast cancer is the most common malignancy among the women worldwide. The incidence is increasing throughout the world. The facilities for its early diagnosis and proper treatment are meagre in the resource poor countries of Asia and Africa. [1] Breast cancer is treated by a combination of surgery, chemotherapy, and radiotherapy. Several non-invasive techniques are currently being explored for the detection of breast cancer through imaging or spectroscopy. Optical imaging methods such as fluorescence imaging, Raman spectroscopy, diffuse optical tomography, and optical coherence tomography are emerging as promising structural and molecular imaging techniques for cancer diagnosis [2-6]. These optical techniques can provide information about biochemical and morphological changes for cancer in short duration of time and allow real time imaging of large area of tissue rather than point by point measurements of suspicious regions. Among these techniques, fluorescence spectroscopy is most promising and is being widely explored for diagnosis mainly because fluorescence is highly sensitive to the biochemical make up of human tissues [7,8]. Fluorescence spectroscopy deals with molecular transition; thus, the spectra is directly linked to molecular changes within tissue.
The fluorescence arising from endogenous fluorescent molecules (fluorophores) is intrinsic properties of human cells and tissues when they have absorbed light and it is called autofluorescence. Optical imaging has some advantages over established modalities for imaging of the breast tissue. It provides clinically relevant information on the composition of glandular tissue (e.g., fat and water content) and other physiological information such as haemoglobin and oxygen saturation [9-14]. Because of the difficulty in detecting and interpreting autofluorescence signal due to low intensity and spectral complexity, some researchers have shifted their focuses towards studies on exogenous fluorophores in order to increase the detection specificity. Most importantly, benign lesions such as inflammation and pigmented lesions may give rise to a high rate of false positives, which is the main disadvantage of the autofluorescence technique [15-16]. The selected fluorescent agent can emit strong fluorescent signal for high detection sensitivity since autofluorescence can contribute a significant back ground signal and obfuscate fluorescence images at low fluorophore concentration. However, issues relating to the safety and toxicity of the contrast agent (exogenous fluorophore) need to be ascertained. Fluorescein sodium is used as an exogenous fluorophore in this study. Although fluorescein has not been used previously for the detection of breast cancer using fluorescence spectroscopy, it has been used for other applications.
The surgeon operating on breast cancer has to remove the entire tumour without leaving any cancer cells in the breast. The identification of residual tumour cells is a challenge and optical techniques can offer immediate detection by virtue of specific fluorescent spectrum emanating from cancer cells [17]. The spectroscopic method can be repeated as often as necessary without adverse effects, for example, to use the method for monitoring neoadjuvant chemotherapy [18-19].
The fluorescence technique is ideally suitable for the detection of early transformation because of its ability to examine tissue surfaces rather than tissue volumes. If fluorescence spectroscopy can be applied successfully as a diagnostic technique in the clinical context, it may increase the potential for curative treatment and thus reduce complications and healthcare costs. Furthermore, since this technique can discriminate between diseased and non-diseased tissues in a fast and non-invasive manner, it could also be used to define margins of resection such as breasts. Additionally, this technique could also be used to monitor the responses of tissues to various therapeutic interventions.
In this study, autofluorescence and fluorescence spectroscopy of the breast cancer tissues is done in ex-vivo mode with a standard system (Shimadzu RF 6000). The autofluorescence spectroscopy of the breast tissues probes the difference in properties of the native fluorophores of cancerous and normal tissues, whereas the fluorescence spectroscopy probes the attachment of the exogenous fluorophores in cancerous and normal tissues, which further tells about the heterogeneity changes in the tissues.
The aim of this ex-vivo study was to obtain and analyse the characteristics of autofluorescence emission spectra as well as fluorescence spectra based on exogenous fluorophore (fluorescein sodium) in samples of breast tissue during breast surgery, using fluorescence spectroscopy and the possibility of developing in-vivo technique in future as a real-time non-invasive tool for detection of breast cancer at an early stage and assessment of tumour margin during surgery. The present study is an extension of our previous work where only fluorescence spectroscopy of breast tissues with their margins in the operation theatre is done. [20]
The approval of protocol (revised) from ethics committee for post graduate research of the institute was received vide letter dated 25-03-21.
2.0 Fluorescence Emission Process
The fluorescence arising from endogenous fluorophores molecules (fluorophores) is an intrinsic property of human cells and tissues when they have absorbed light, and it is called autofluorescence. When a biological molecule is illuminated at an excitation wavelength which lies within absorption spectrum of that molecules, it will absorb this energy and be activated from its ground state (state of the lowest energy, S0) to an excited state (sate of high energy S1). The molecule can then be relaxed back from the excited state to the ground state by generating energy in the form of fluorescence, at emission wavelength, which are longer than that that of the excitation wavelength. This is illustrated schematically in Fig. 1. A molecule may be non-fluorescent as a result of non-radioactive decay (thermal generation) or a slow rate of a radioactive decay. The fluorescence intensity of a biological molecule is a function of its concentration, its extinction coefficient (absorbing power) at the excitation wavelength and its quantum yield at the emission wavelength.
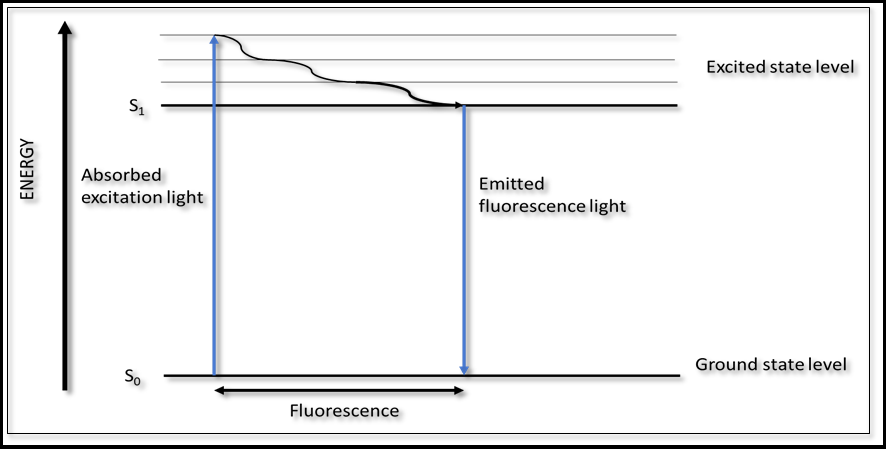
Figure 1: Energy level diagram illustrating the phenomena of absorption and fluorescence
3.Methodology
3.1 Tissue samples obtained from specimens of 40 female patients of age more than 18 years undergoing mastectomy and free from other diseases were selected for the study. The key clinical parameters of patients who consented to give samples from breast tumour after surgery are summarized in table 1-:
Table 1: Key clinical parameters of selected patients
|
Parameters |
|
No. of patients |
|
Descriptions |
Criteria |
|
|
Age |
<50 years |
25 |
|
>50 years |
15 |
|
|
Tumour Size |
<4 cm |
14 |
|
>4 cm |
26 |
|
|
Pathology |
Invasive ductal carcinoma |
32 |
|
Invasive lobular carcinoma |
8 |
|
|
Chemotherapy |
Post chemotherapy |
15 |
|
Pre chemotherapy |
25 |
3.2 Preparation of tissue samples
Samples of breast cancer and normal tissues were obtained from mastectomy specimens of patients undergoing surgery in OT of AIIMS, New Delhi. Surgeon provided cancerous tissue samples which vary in size from 0.5x0.5x0.5 to 1x1x1 cm (length, width and thickness) from tumour specimens and normal breast tissues sample of size 2x2x2 cm from uninvolved areas of mastectomy samples (about 3-4 cm away from tumour to ensure that tissue is healthy and free from carcinoma). All samples were collected in sterile sample- holders having 0.9% sodium chloride solution at 40C to prevent any unwanted deformation and kept in the pathology department. The samples are taken to the Bio-photonics department in IIT, Delhi, for sample preparation and to obtain emission spectra. Samples were neither chemically treated nor frozen prior to experiments. The time elapsed between tissue resection and fluorescent measurements may vary for different sample sources. The longest elapsed time was 12 hours. Tissue samples are then cut to 10µm thick slices with 2 m cross-sections, using a microtome. To prepare samples stained with fluorescein, normal and cancer tissue of the same patient were stained with fluorescein (0.25 ml of 20% fluorescein in 4 ml of saline) by brush and then air-dried for about 10 minutes.
3.3 Selection of exogenous agent (fluorescein concentration)
In this study, fluorescein sodium (C20H10Na2O5) was used as an exogenous fluorophore since it is comparatively bright among available exogenous fluorophores. The fluorescence from fluorescein molecule (exogenous fluorophore) is very intense than the endogenous fluorophores and it is non-toxic and safe. The excitation spectra of three different concentrations of fluorescein (0.25 ml, 0.5 ml, and 1 ml of 20% fluorescein in 4 ml of saline water) using the spectrofluorometer (Shimadzu RF 6000) showed peak relative intensity at a wavelength of 490 nm for a fixed emission wavelength of 520 nm. Similarly, emission spectra of each concentration of fluorescein based on a fixed excitation wavelength of 490nm showed peak relative intensity at the wavelength of 520 nm. These are presented in Fig. 1(a) and Fig. 1(b). Since the intensity (~350,000) was found to be higher in the lower dilution of fluorescein, (0.25ml of 20% fluorescein in 4 ml of saline water), it was chosen as a exogenous fluorophore for the study with an excitation wavelength of 490 nm.
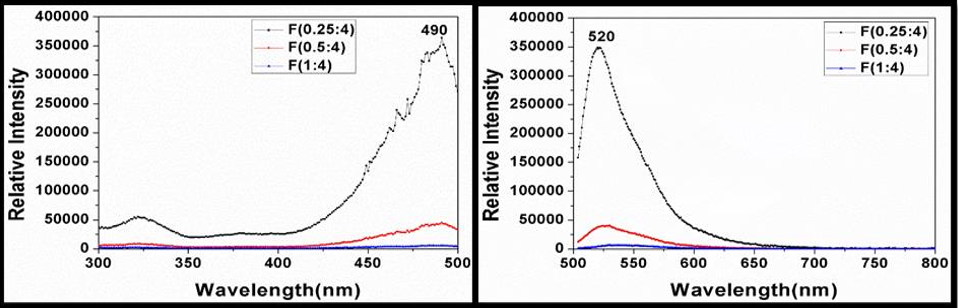
Figure 2: (a) Excitation spectra for various concentrations of fluorescein. (b) Emission spectra of various concentrations of fluorescein
3.4 Recording of emission spectra using fluorescence spectroscopy
Fluorescence spectra of the tissue sample were measured using a spectrofluorometer (Shimadzu Corporation, Japan, model no RF 6000/ A 402454006005A) having a double monochromator equipped with a broadband light source (Xenon lamp). The sensor was set at 900 relative to the excitation light. Initially, autofluorescence of normal and cancer tissues was taken with an excitation wavelength of 490 nm. Subsequently, emission spectra of the same samples stained with fluorescein were also obtained using the same excitation wavelength of 490 nm. The fluorescence of samples was obtained with a resolution of 1nm and a scan speed of 200 nm/min from the front face of tissue samples to reduce the distortion of absorption and scattering. The fluorescence data (relative intensity against wavelength at an interval of 1nm) for each sample where then converted to emission spectra with help of software package (origin pro 2021b). Fluorescence data of each sample were then normalized by dividing each intensity value by the maximum intensity value of respective spectra to regularise data concerning variation in sample preparation, sample thickness, detector, amplifier setting, and any other aspects of measurements in order to convert the original emission spectra to normalized spectra. Similarly, emission spectra of all 40 pairs of samples were obtained.
4.0 Results and Analysis
The characteristics of each emission spectrum, such as peak emission wavelength, broadness of emission spectra at FWHM (width of an optical signal at half its max intensity), area under emission spectra intensity (integrated over the entire wavelength), peak relative intensity for normal and cancer tissues for 40 pairs of samples in case of autofluorescence and stained with fluorescein were measured from normalized spectra. From characteristics data pertaining to emission spectra of 40 pairs of specimens, it was observed that values of characteristics of emission spectra for cancer tissues were found to be higher than values of respective normal tissues for both autofluorescence and samples stained with fluorescein in 92.5% of cases. Also, values of characteristics of emission spectra for stained fluorescein samples with fluorescein were found to be higher than values of respective values of autofluorescence in 92.5% of cases. A detailed discussion regarding autofluorescence and fluorescence spectroscopy of breast tissues (normal and cancerous) done in the following sections:
4.1 Autofluorescence Emission spectra
Breast tissue is mainly composed of an extracellular matrix of collagen, fibre, fat and epithelial cells. Epithelial cells, where cancer primarily happens, contain a number of natural fluorophores [21]. Natural fluorophores are molecules involved in structural and metabolic functions in cells and tissue. Natural fluorophores exist in tissue and cells that, when excited with ultraviolet & visible light, fluoresce over well-defined spectral regions (known as autofluorescence) [22]. These endogenous fluorophores include amino acids, structural proteins, enzymes and coenzymes, vitamins, lipids, and porphyrins. The fluorescence of breast tissue depends on the concentration and distribution of fluorophores present in the tissue as well as the biochemical/ biophysical environment, which may alter the quantum yield and lifetime of fluorophores. It also depends on the absorption and scattering of those results from the concentration and distribution of non-fluorescent absorbers and scatters. [23]
The autofluorescence spectra of the breast tissues of a particular patient for an excitation wavelength of 490 nm are shown in Figure 3. Figure 3(a) is indicating the normalized autofluorescence spectrum of normal tissue of the patient with peak emission wavelength 523 nm. λ1 and λ2 are two points on emission spectra at 50% of peak intensity and λ2-λ1 is width of spectrum. Figure 3(b) is indicating the normalized autofluorescence spectrum of cancer tissue of the same patient as in Figure 3(a). Figure 3 (c) is autofluorescence spectra of normal and cancer tissues showing maximum intensities and indicating that cancerous tissue has more counts than normal. Figure 3(d) is depicting the mean autofluorescence spectra of the hole data set with emission peak wavelengths of about 522±1.05 nm and 524.5±1.181nm and maximum intensity counts of about 134119 and 223580 of normal and cancerous tissues, respectively. After the main peak, the tumour tissue shows a monotonic decrease with a tiny plateau observed around 555 nm in emission spectra of both normal and cancer tissues, the fluorophores responsible for 522 nm and 555 nm are associated with the flavins/FAD and porphyrins respectively. This is supported by the fact that the excitation spectra corresponding to these emission bands resemble the absorption spectra of corresponding fluorophores. A similar spectral profile was observed for the other 39 pairs of specimens also.
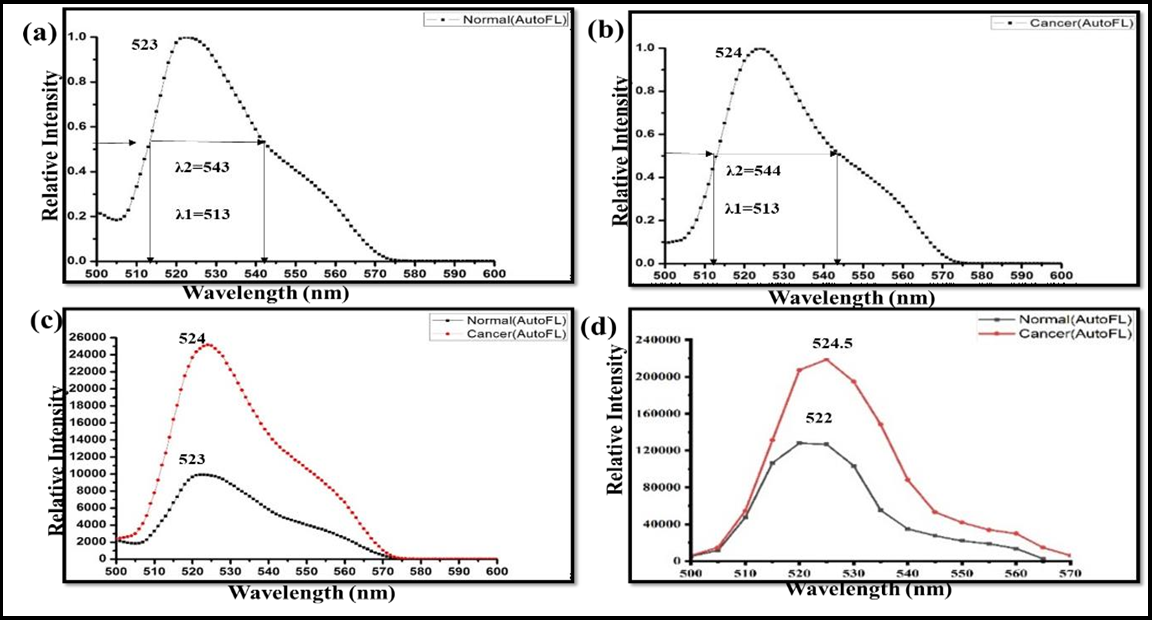
Figure 3: Autofluorescence spectra breast tissue of a patient. (a) Normalized autofluorescence spectrum of normal breast tissue indicating peak emission wavelength. (b) Normalized autofluorescence spectrum of breast cancer tissue indicating peak emission wavelength. (c) Autofluorescence spectra of normal and cancer tissue showing maximum intensity counts. (d) Mean autofluorescence spectra of the whole data set with maximum intensity counts and peak emission wavelength.
The characteristics of emission spectra (normalised) acquired with an excitation wavelength of 490 nm in the case of autofluorescence for normal and cancer tissues are provided in Table 2.
Table 2: Characteristics of emission spectra of normal and cancer tissues (Autofluorescence)
|
Characteristics |
|
|
|||||||
|
Normal |
Cancer |
t-test |
|||||||
|
Max |
Min |
Mean |
SD |
Max |
Min |
Mean |
SD |
p |
|
|
Peak emission wavelength (nm) |
525 |
521 |
522 |
1.05 |
526 |
521 |
524.4 |
1.181 |
<0.0001 |
|
FWHM (λ2- λ1) nm |
37 |
15 |
28.3 |
5.232 |
42 |
16 |
30.97 |
5.242 |
<0.0001 |
|
Area under the spectra curve |
36.23 |
16.48 |
30.28 |
5.616 |
40.12 |
16.22 |
33.11 |
4.684 |
<0.0001 |
|
Peak Relative intensity |
1629366 |
394 |
134119 |
399084 |
2502475 |
1232 |
223580 |
597381 |
<0.0001 |
Changes in fluorescence spectra in terms of shape and peak intensity acquired with the selective excitation wavelength of 490 nm was observed for cancer tissues compared with normal tissues. We are getting peak intensity (mean) for cancer tissue about 1.67 times that of normal tissues and shifted peak emission wavelength of about 2.5 nm (mean).
Major fluorophores which are relevant to oncology applications are tryptophan, collagen, and elastin, reduced nicotinamide adenine dinucleotide and its phosphate (NADPH), flavins adenine dinucleotide (FAD), beta-carotene and porphyrins [24]. During tumour formation, changes occurring in cell and tissue state during physiological and pathological processes result in modification of the amount and distribution of endogenous fluorophores and chemico- physical properties of their microenvironment [25]. It has been shown that the distinct fluorescence response of cancer tissues compared to normal tissues is a notable difference in concentration of collagen, elastin, NADH, and FAD [26]. Fluorescence measurements had indicated earlier lower concentrations of collagen and FAD and increased concentration of NADPH in cancer tissues compared to normal breast tissues [27] resulting increase in peak intensity and spectral shift. It is also known that the anaerobic component of energy metabolism increases while the aerobic component decreases in cancer cells compared to normal ones. The decreased efficiency of aerobic increases the reduced pool of pyridine nucleotide, which causes the greater fluorescence intensity as observed in cancer cells. [28]
4.2 Fluorescence Emission Spectra
The advantages of this modality are good visualization of the tumour area with a strong fluorescent signal, less ambiguity relative to autofluorescence and their applicability is relative mainly to selective localization in the tissue of interest. [29] The fluorescence detected from tissue samples stained with an exogenous fluorophore (fluorescein sodium) consists of both autofluorescence and fluorescence from the tissues. But due to the high sensitivity of fluorescein sodium, autofluorescence of the tissues is suppressed and only fluorescence spectra are recorded.
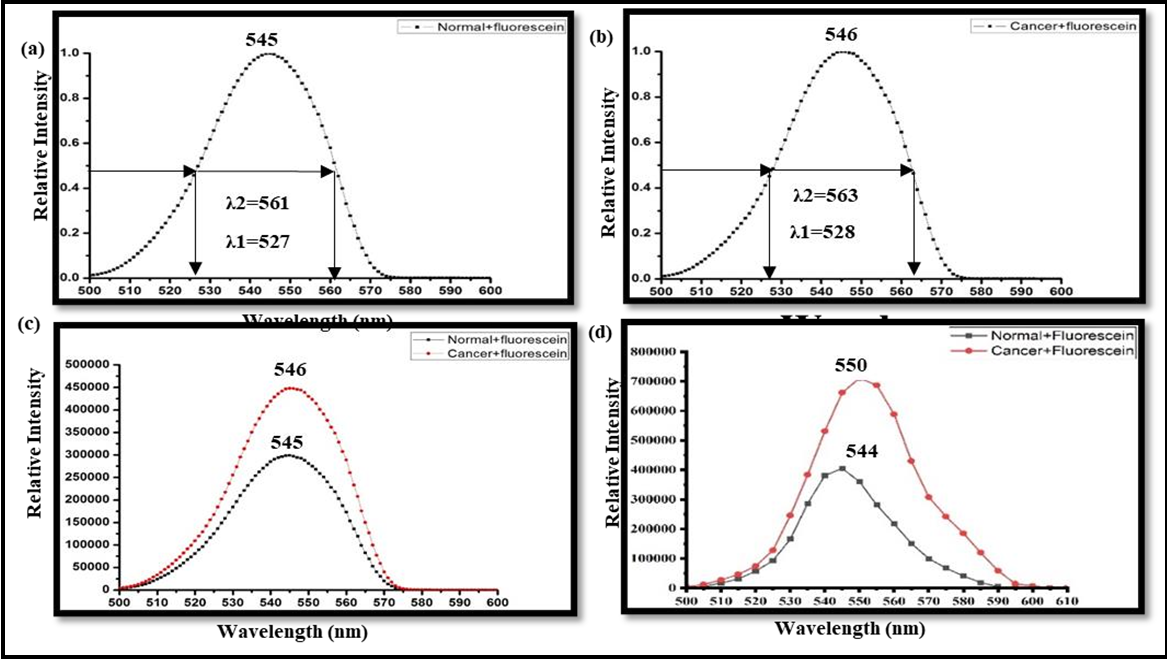
Figure 4: Fluorescence spectra of breast tissue stained with fluorescein sodium. (a) Normalized fluorescence spectrum of normal breast tissue indicating peak emission wavelength at 545 nm. (b) Normalized fluorescence spectrum of breast cancer tissue indicating peak emission wavelength at 546 nm. (c) Fluorescence spectra of normal and cancer tissue showing maximum intensity counts. (d) Mean fluorescence spectra of the whole data set with maximum intensity counts and peak emission wavelength.
The fluorescence spectra (normalized) of the breast tissues of same patient stained with fluorescein for an excitation wavelength of 490 nm are shown in Figure 4. Figure 4(a) is indicating the fluorescence spectrum of normal tissue of the same patient as in Fig.4 with peak emission wavelength 545 nm. Figure 4(b) is indicating the fluorescence spectrum of cancer tissue of the same patient as in Figure. 3 with a peak emission wavelength of 546 nm. λ1 and λ2 are the wavelengths depicting broadband. Figure 4(c) is showing fluorescence spectra of normal and cancer tissues showing maximum intensity and indicating that cancerous tissue has more counts than normal. Figure 4(d) is depicting the mean autofluorescence spectra of the whole data set with emission peak wavelengths of about 544±2.157 nm and 550±4.025 nm and mean maximum intensity counts of about 406448 and 749530 of normal and cancerous tissues, respectively. Spectrum in the case of samples stained with fluorescein shows a gradual decrease in intensity with no clear subsidiary maxima after the peak intensity. Similar spectral profiles were observed for the other 39 pairs of specimens also.
In this case, also, changes of fluorescence spectra in terms of shape and peak intensity were observed for cancerous tissue compared with normal tissue, and in the case of cancerous tissue, we are getting peak intensity (mean) in case of cancer tissues about 1.84 times that of normal tissues and shifted peak emission wavelength of about 6 nm (mean). There is a spectral shift (mean) of 22.5 nm and 25.5 nm of normal and cancer tissues, respectively, in the case of samples stained with fluorescein with respect to autofluorescence. The characteristics of emission spectra for normal and cancer tissues stained with fluorescein acquired with selective excitation of 490 nm are provided in Table 3.
Table 3: Characteristics of emission spectra of normal and cancer tissues- stained with fluorescein
|
Characteristics |
Stained with fluorescein |
|
|||||||
|
Normal |
Cancer |
t-test |
|||||||
|
Max |
Min |
Mean |
SD |
Max |
Min |
Mean |
SD |
p |
|
|
Peak emission wavelength (nm) |
553 |
541 |
544.47 |
2.157 |
558 |
545 |
550 |
4.025 |
<0.0001 |
|
FWHM (λ2- λ1) nm |
48 |
15 |
34.02 |
7.44 |
53 |
22 |
40.3 |
6.86 |
<0.0001 |
|
Area under the spectra curve |
45.18 |
14.54 |
34.06 |
7.009 |
48.37 |
21.01 |
40 |
5.119 |
<0.0001 |
|
Peak Relative intensity |
3364819 |
3466 |
406448 |
782368 |
550025 |
6463 |
749530 |
1210211 |
<0.0001 |
Spectral shift of emission spectra for cancerous tissues with respect to respective normal tissues in case of autofluorescence as well as samples stained with fluorescein was observed. The red shift of emission spectra for cancer tissues with respect to respective normal tissues was observed for 37 specimens (out of 40 specimens) in the case of autofluorescence as well as samples stained with fluorescein. Characteristics data of spectral red shift of cancer tissue are provided in Table 4.
Table 4: Characteristics of the spectral shift in autofluorescence and stained with fluorescein.
|
Characteristics |
Autofluorescence |
Stained with fluorescein |
t-test |
||||||
|
Max |
Min |
Mean |
SD |
Max |
Min |
Mean |
SD |
p |
|
|
Spectral redshift of emission spectra |
5 |
1 |
2.65 |
1.245 |
13 |
1 |
6.03 |
3.229 |
<0.0001 |
The mean value of the red shift of emission spectra of cancer tissues was found at 2.65±1.245 nm and 6.03±3.229 nm in the case of autofluorescence and sample stained with fluorescein, respectively. The main reason behind this red shift is the heterogeneity of the microenvironment of the tumour [20,31,32]. The tumour microenvironment is drastically changed in terms of cell invasion, increased heterogeneity, increase refractive index, and optical density in comparison to the normal microenvironment. The increased optical density then leads to the higher reabsorption rate of the fluorescein molecule within the tumour environment and gives the shifted emission [30-31]. There are a number of optical phenomena that occur in the tumour environment which signifies this red-shift in fluorescence emission. As the heterogeneity of cancer increases, scattering of the incident photon increases; also, the absorption in the tumour is high compared to normal tissues. This scattering and absorption lead to a longer random walk of the incident photon in the fluorescein-tagged tumour microenvironment [30-31]. Due to this longer random walk, the reabsorption of the photon is highly increased which gives a shifted emission in fluorescence peak wavelength. Also, the cancer cells have glycoprotein in their exterior surface which is highly negative and shows the increment in pH or makes it alkaline to some extent. The pH of fluorescein dye is alkaline and more prone to alkaline solution and gives high contrast which makes the tumour area/tissues highly fluorescence contrast substance compared to normal tissues. Further, this increment in negatively charged ions (increased number of electrons) depicts the formation of more pi bonds in cancerous tissue/area compared to normal area/tissues. Then due to the increased pi bonds, the difference between molecular orbitals is thoroughly decreased and gives a shifted emission in fluorescence in cancerous environment [20,30- 31].
4.3 Statistical Analysis (paired t-test)
The paired t-test between two groups of each characteristic data of emission spectra between normal and cancer tissues in case of autofluorescence as well as samples stained with of all 40 pairs of specimens was carried out using SPSS 17.0 software with 95% confidence level and p-values are indicated in Table 2, 3 and 4.
Similarly, paired t-test of each characteristic of emission spectra for normal and cancer tissues between autofluorescence and samples stained with fluorescein was carried out and -values are found less than 0.0001. p-values between two groups of data (normal tissue vs cancer tissue) against each characteristic of emission spectrum in the case of autofluorescence and stained with fluorescein are also indicated in Tables 1 & 2 respectively.
From the characteristics of emission spectra, a significant increase in peak relative intensity of spectra for cancer tissues was observed compared to that of normal tissues in the case of autofluorescence as well as samples stained with fluorescein. The mean values of the characteristics of emission spectra of all 40 patients for cancer tissues were found to be higher than that of normal tissues in both cases. Similarly, the mean values of the characteristics of emission spectra of 40 patients for samples stained with fluorescein (exogenous fluorophore) were found to be higher than the respective mean values of autofluorescence for both normal and cancer tissues. In case of samples stained with fluorescein, the mean value of peak intensity of spectra for normal and cancer tissue in was found to be 3.03 times and 3.35 times respectively of autofluorescence value for normal and cancer tissues. The ratio of mean spectrally integrated intensity from cancer tissues with that of normal tissues was found to be 1.09 and 1.17 in the case of autofluorescence and samples stained with fluorescein, respectively.
In summary, owing to the high sensitivity of fluorescence spectroscopy, breast cancer tissue, and normal tissue could be distinguished due to the different peaks and shapes of emission spectra in both cases. In addition to spectral changes of fluorescence imaging, normal and cancer tissues could be distinguished by observing fluorescence contrast. The fluorescence technique is relatively simple, cost effective, high sensitivity and specificity compared to other imaging techniques. The high sensitivity and specificity of autofluorescence technique coupled with its fast and non-invasive detection capability can render it useful in both screening and diagnostic settings.
5. Limitations
The number of breast tissue samples collected during the study was limited due to time limitation. Apart from invasive ductal carcinoma (IDC) tissue samples and few invasive lobular carcinoma, other types of breast cancer, such as ductal carcinoma in-situ (DCIS) and more invasive lobular carcinoma (ILC) samples, could not be done due to non-availability of patients. There was uncertainty of dye uptake by ex-vivo tissue samples as samples were simply brushed with fluorescein. Another limitation was immediate measurement of spectra after resection due to logistic issue.
6. Conclusion
A distinct difference in the fluorescence spectra of cancerous and normal breast tissue was observed in the case of autofluorescence as well as in the fluorescence spectra. Moreover, the intensity of fluorescence of cancer tissues was observed to be higher than that of respective normal breast tissues in both cases. These alterations are the result of exceptionally high sensitivity of fluorescence on the biochemical makeup of tissues. This study demonstrates that native fluorescence spectroscopy may be used to investigate the changes in relative contents of the key native fluorophores between cancerous and normal breast tissue. We have observed an average peak maximum intensity at wavelengths of 522± 1.05 nm and 524.4±1.181 nm for normal and cancerous tissues in the autofluorescence spectra of breast tissues with the intensity counts of ~134119 and ~223580, respectively. In the case of fluorescence spectroscopy, peak maximum intensity at a wavelength of 544.47±2.156 nm and 550±4.025 nm for normal and cancerous tissues were found, and intensity counts to be ~406448 and ~749530, respectively. Additionally, in the case of samples stained with fluorescein, an average of 6.03 nm red shift was observed in the emission spectra of the breast cancer tissues with respect to normal tissues. This study might find application in the future for real-time tumor margin assessment using autofluorescence and fluorescence spectroscopy during surgery.
References
- Breast cancer by WHO.
- Abramczyk H, Brozek-Pluska B, Jarota A, Surmacki J, Imiela A, et al. (2020) A look into the use of Raman spectroscopy for brain and breast cancer diagnostics: linear and non-linear optics in cancer research as a gateway to tumor cell identity. Expert review of molecular diagnostics. 20(1): 99-115.
- Lazaro-Pacheco D, Shaaban AM, Titiloye NA, Rehman S, Rehman IU (2021) Elucidating the chemical and structural composition of breast cancer using Raman micro-spectroscopy. Applied Spectroscopy Reviews. 55(6): 439-475.
- Manoharan R, Shafer K, Perelman L, Wu J, Chen K, et al. (1998) Raman Spectroscopy and Fluorescence Photon Migration for Breast Cancer Diagnosis and Imaging. Photochemistry and Photobiology. 67(1): 15-22.
- Redd DCB, Feng ZC, Yue KT, Gansler TS (1993) Raman Spectroscopic Characterization of Human Breast Tissues: Implications for Breast Cancer Diagnosis. Applied spectroscopy. 47(6): 787-791. (1993)
- Volynskaya Z, Haka AS, Bechtel KL, Fitzmaurice M, Shenk R, et al. (2008) Diagnosing breast cancer using diffuse reflectance spectroscopy and intrinsic fluorescence spectroscopy. Journal of biomedical optics. 13(2): 024012-024012.
- Evers, D. J., B. H. W. Hendriks, G. W. Lucassen, and T. J. M. Ruers. Future oncology. 8, 2012, no. 3: 307-320.
- Alchab L, Dupuis G, Balleyguier C, Mathieu MC, Fontaine- Aupart MP, et al. (2010) Journal of Biophotonics. 3: 2010, no. 5‐ 6: 373-384.
- Noika S, Chance B (2005) Technol. Cancer Research Treat 4. 2005: 497-512.
- Grosenick D, Moesta KT, Wabnitz H, Mucke J, Stroszczynski C, et al. (2003) Time-domain optical mammography: initial clinical results on detection and characterization of breast tumors. Applied optics. 42(16): 3170-3186.
- Dehghani H, Pogue BW, Poplack SP, Paulsen KD (2003) Multiwavelength three-dimensional near-infrared tomography of the breast: initial simulation, phantom, and clinical results. Applied Optics. 42(1): 135-145.
- Key H, Davies ER, Jackson PC, Wells PNT (1991) Optical attenuation characteristics of breast tissues at visible and near- infrared wavelengths. Physics in medicine & biology. 36(5): 579.
- Srinivasan S, Pogue BW, Jiang S, Dehghani H, Kogel C, et al. (2003) Interpreting hemoglobin and water concentration, oxygen saturation, and scattering measured in vivo by near-infrared breast tomography. Proceedings of the National Academy of Sciences. 100(21): 12349-12354.
- Tromberg BJ, Shah N, Lanning R, Cerussi A, Espinoza J, Pham T, et al. (2000) Non-Invasive In Vivo Characterization of Breast Tumors Using Photon Migration Spectroscopy1. Neoplasia. 2(1- 2): 26-40.
- Malzahn K, Dreyer T, Glanz H, Arens C (2002) Autofluorescence endoscopy in the diagnosis of early laryngeal cancer and its precursor lesions. The Laryngoscope. 112(3): 488-493.
- Zargi M, Fajdiga I, Smid L (2000) Autofluorescence imaging in the diagnosis of laryngeal cancer. European archives of oto-rhino- laryngology. 257(1): 17-23.
- Wilke LG, Brown JQ, Bydlon TM, Kennedy SA, Richards LM, et al. (2009) Rapid noninvasive optical imaging of tissue composition in breast tumor margins. The American Journal of Surgery. 198(4): 566-574.
- Choe R, Corlu A, Lee K, Durduran T, Konecky SD, et al. (2005) Diffuse optical tomography of breast cancer during neoadjuvant chemotherapy: A case study with comparison to MRI. Medical physics. 32(4): 1128-1139.
- Zhu Q, Kurtzma SH, Hegde P, Tannenbaum S, Kane M, et al. (2005) Utilizing Optical Tomography with Ultrasound Localization to Image Heterogeneous Hemoglobin Distribution in Large Breast Cancers1. Neoplasia. 7(3): 263-270.
- Thapa P, Singh V, Bhatt S, Tayal S, Mann P, et al. (2022) Development of multimodal micro-endoscopic system with oblique illumination for simultaneous fluorescence imaging and spectroscopy of oral cancer. Journal of Biophotonics. 15(6): e202100284.
- Heintzelman DL, Lotan R, Richards‐Kortum RR (2000) Characterization of the Autofluorescence of Polymorphonuclear Leukocytes, Mononuclear Leukocytes and Cervical Epithelial Cancer Cells for Improved Spectroscopic Discrimination of Inflammation from Dysplasia. Photochemistry and photobiology. 71(3): 327-332.
- Dramićanin T, Dramićanin M (2016) Using fluorescence spectroscopy to diagnose breast cancer. Stauffer. Appl Mol Spectrosc to Curr Res Chem Biol Sci.
- Ramanujam N (2000) Fluorescence spectroscopy of neoplastic and non-neoplastic tissues. Neoplasia. 2(1-2): 89-117.
- Andersson-Engels S, Wilson BC (1992) In vivo fluorescence in clinical oncology: fundamental and practical issues. Journal of Cellular Pharmacology. 3(1992): 66-79.
- Monici M (2005) Cell and tissue autofluorescence research and diagnostic application. Biotechnology annual review. 11: 227- 256.
- Dramićanin T, Dramićanin MD, Jokanović V, Nikolić‐ Vukosavljević D, Dimltrijević B (2005) Three-dimensional Total Synchronous Luminescence Spectroscopy Criteria for Discrimination Between Normal and Malignant Breast Tissues. Photochemistry and photobiology. 81(6): 1554-1558.
- Tatjana D, Lea L, Ivan a Z, Miroslav D. D (2012) Biophysical characterization of human breast tissues by photoluminescence excitation-emission spectroscopy. Journal of Research in Physics. 36(1): 53-62.
- Warburg O (1956) On the origin of cancer cells. Science. 123(3191): 309-314.
- Sieroń A, Sieroń-Stołtny K, Kawczyk-Krupka A, Latos W, Kwiatek S, et al. (2013) The role of fluorescence diagnosis in clinical practice. Onco Targets and therapy. 6: 977-982.
- Thapa P, Singh V, Gupta K, Shrivastava A, Kumar V, et al. (2023) Point-of-care devices based on fluorescence imaging and spectroscopy for tumor margin detection during breast cancer surgery: Towards breast conservation treatment. Lasers in Surgery and Medicine. 55(4): 423-436.
- Alfano RR, Seddon AB, Shi L (2023) Optical Biopsy XXI: Toward Real-Time Spectroscopic Imaging and Diagnosis. SPIE. 12373: 33-38.